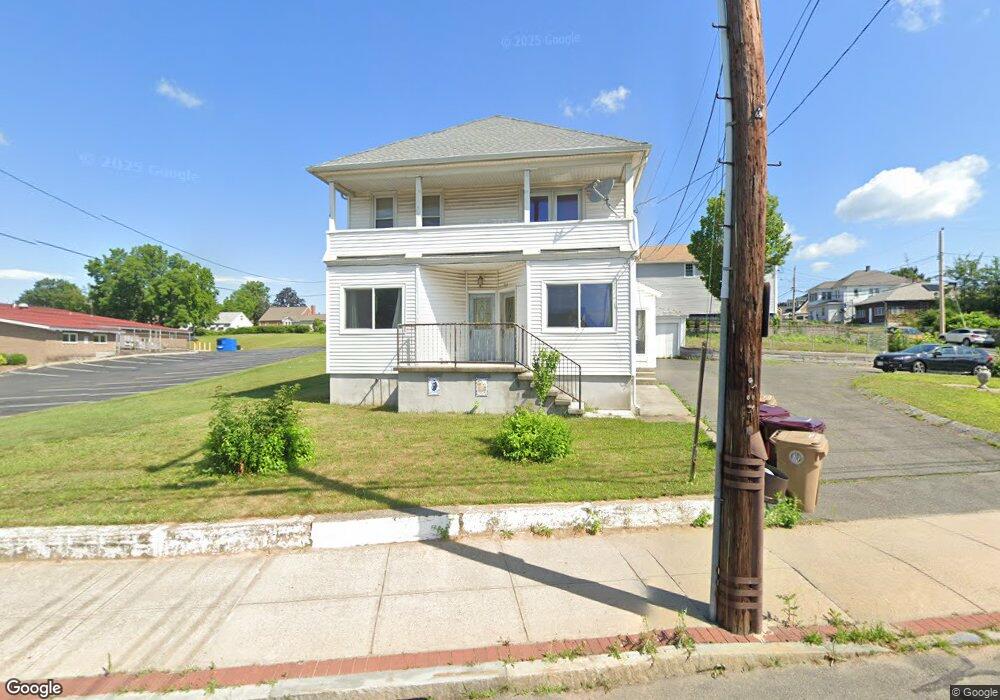
369 East St Unit 1 Ludlow, MA 01056
Estimated Value: $337,722 - $539,000
3
Beds
1
Bath
1,200
Sq Ft
$343/Sq Ft
Est. Value
About This Home
This home is located at 369 East St Unit 1, Ludlow, MA 01056 and is currently estimated at $411,431, approximately $342 per square foot. 369 East St Unit 1 is a home located in Hampden County with nearby schools including East Street Elementary School, Chapin Street Elementary School, and Paul R. Baird Middle School.
Ownership History
Date
Name
Owned For
Owner Type
Purchase Details
Closed on
Aug 6, 2020
Sold by
Ferreira Acacio M
Bought by
Ferreira Acacio M and Ferreira Bryan
Current Estimated Value
Purchase Details
Closed on
Jun 17, 2005
Sold by
Lopes Luis F and Lopes Palmira G
Bought by
Ferreira Acacio M
Home Financials for this Owner
Home Financials are based on the most recent Mortgage that was taken out on this home.
Original Mortgage
$215,000
Interest Rate
5.78%
Mortgage Type
Purchase Money Mortgage
Purchase Details
Closed on
Oct 27, 2000
Sold by
Dejesus Joseph M and Dejesus Cheryl A
Bought by
Lopes Luis F and Lopes Goncalves-Lopes P
Purchase Details
Closed on
May 3, 1997
Sold by
Kapinos Sophie M
Bought by
Dejesus Joseph M and Dejesus Cheryl A
Create a Home Valuation Report for This Property
The Home Valuation Report is an in-depth analysis detailing your home's value as well as a comparison with similar homes in the area
Home Values in the Area
Average Home Value in this Area
Purchase History
| Date | Buyer | Sale Price | Title Company |
|---|---|---|---|
| Ferreira Acacio M | -- | None Available | |
| Ferreira Acacio M | -- | None Available | |
| Ferreira Acacio M | $215,000 | -- | |
| Ferreira Acacio M | $215,000 | -- | |
| Lopes Luis F | $86,000 | -- | |
| Lopes Luis F | $86,000 | -- | |
| Dejesus Joseph M | $70,000 | -- | |
| Dejesus Joseph M | $70,000 | -- |
Source: Public Records
Mortgage History
| Date | Status | Borrower | Loan Amount |
|---|---|---|---|
| Previous Owner | Ferreira Acacio M | $215,000 | |
| Previous Owner | Dejesus Joseph M | $20,000 | |
| Previous Owner | Dejesus Joseph M | $64,500 |
Source: Public Records
Tax History Compared to Growth
Tax History
| Year | Tax Paid | Tax Assessment Tax Assessment Total Assessment is a certain percentage of the fair market value that is determined by local assessors to be the total taxable value of land and additions on the property. | Land | Improvement |
|---|---|---|---|---|
| 2025 | $4,960 | $285,900 | $67,500 | $218,400 |
| 2024 | $4,707 | $260,200 | $67,400 | $192,800 |
| 2023 | $4,686 | $240,200 | $59,200 | $181,000 |
| 2022 | $4,598 | $230,000 | $59,200 | $170,800 |
| 2021 | $4,420 | $209,700 | $59,200 | $150,500 |
| 2020 | $4,233 | $205,300 | $58,300 | $147,000 |
| 2019 | $3,992 | $201,400 | $57,700 | $143,700 |
| 2018 | $3,823 | $201,100 | $57,700 | $143,400 |
| 2017 | $3,689 | $199,100 | $56,000 | $143,100 |
| 2016 | $3,497 | $192,900 | $54,900 | $138,000 |
| 2015 | $3,278 | $189,600 | $54,300 | $135,300 |
Source: Public Records
Map
Nearby Homes
- 41 Orchard St
- 287 East St
- 415 Winsor St
- 37 Franklin St
- 32 Berkshire St
- 45 Meadow St
- 87 Haviland St
- 24 Elm St
- 148 Yale St
- 142 Amherst St
- 0 Center St Unit 73415933
- 32 White St
- 89-91 Stony Hill Rd
- 13 - 13.5 Weston St
- 24 Dumaine St
- 51 Parkview St
- 0 Parker St (Ws) Unit 73388310
- 0 Fuller St Unit 73409741
- 2205 Boston Rd Unit I 82
- 70 Fuller St
- 369 East St
- 11 Lockland St
- 17 Lockland Ave
- 387 East St Unit 389
- 374 East St
- 2 Brookfield St Unit 2nd floor
- 378 East St Unit 380
- 21 Lockland Ave
- 364 East St
- 393 East St Unit 2nd floor
- 393 East St
- 386 East St
- 20 Lockland Ave
- 10 Brookfield St
- 11 Warren St Unit 13
- 11-13 Warren St
- 356 East St Unit 358
- 358 East St Unit 358
- 10 Warren St
- 12 Brookfield St Unit 14