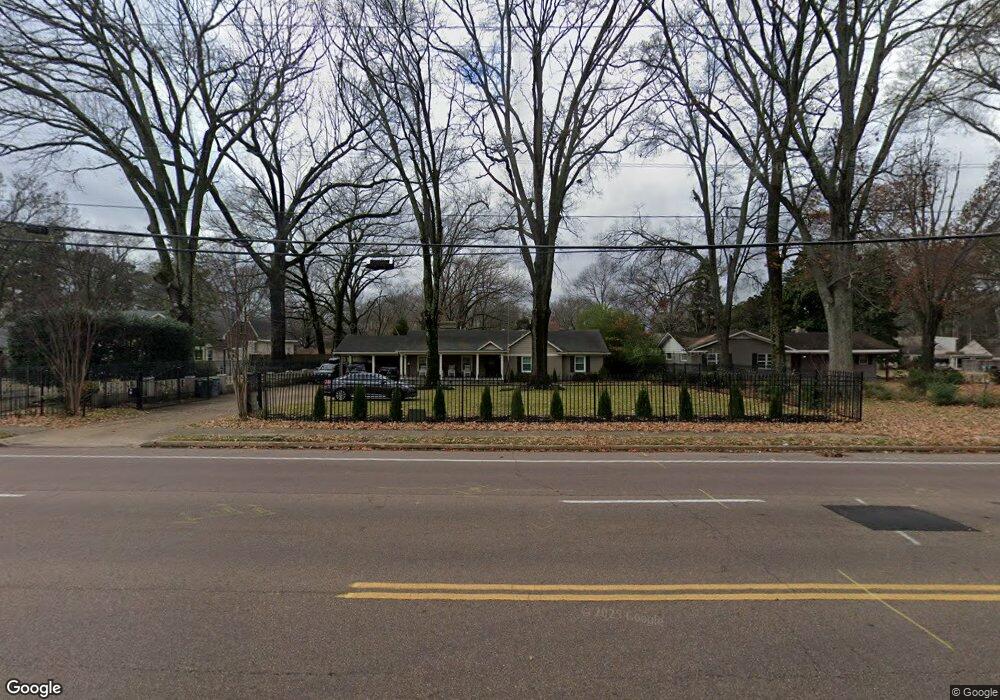
369 N Perkins Rd Memphis, TN 38117
East Memphis NeighborhoodEstimated Value: $384,000 - $561,000
4
Beds
3
Baths
2,766
Sq Ft
$167/Sq Ft
Est. Value
About This Home
This home is located at 369 N Perkins Rd, Memphis, TN 38117 and is currently estimated at $460,806, approximately $166 per square foot. 369 N Perkins Rd is a home located in Shelby County with nearby schools including White Station Elementary School, White Station High, and White Station Middle.
Ownership History
Date
Name
Owned For
Owner Type
Purchase Details
Closed on
May 21, 2015
Sold by
Haselwood Joseph D and Haselwood Meredith
Bought by
Mays Susannah Brent and Mays David Scott
Current Estimated Value
Home Financials for this Owner
Home Financials are based on the most recent Mortgage that was taken out on this home.
Original Mortgage
$178,000
Outstanding Balance
$66,406
Interest Rate
3.75%
Mortgage Type
New Conventional
Estimated Equity
$394,400
Purchase Details
Closed on
Apr 28, 2006
Sold by
Farris James David
Bought by
Haselwood Ii Joseph D and Haselwood Meredith
Home Financials for this Owner
Home Financials are based on the most recent Mortgage that was taken out on this home.
Original Mortgage
$46,200
Interest Rate
6.33%
Mortgage Type
Stand Alone Second
Purchase Details
Closed on
Jan 31, 2005
Sold by
Hunter Howard K
Bought by
Farris James David
Create a Home Valuation Report for This Property
The Home Valuation Report is an in-depth analysis detailing your home's value as well as a comparison with similar homes in the area
Home Values in the Area
Average Home Value in this Area
Purchase History
| Date | Buyer | Sale Price | Title Company |
|---|---|---|---|
| Mays Susannah Brent | $266,000 | None Available | |
| Haselwood Ii Joseph D | $231,000 | None Available | |
| Farris James David | $169,000 | Realty Title |
Source: Public Records
Mortgage History
| Date | Status | Borrower | Loan Amount |
|---|---|---|---|
| Open | Mays Susannah Brent | $178,000 | |
| Previous Owner | Haselwood Ii Joseph D | $46,200 | |
| Previous Owner | Haselwood Ii Joseph D | $184,800 |
Source: Public Records
Tax History
| Year | Tax Paid | Tax Assessment Tax Assessment Total Assessment is a certain percentage of the fair market value that is determined by local assessors to be the total taxable value of land and additions on the property. | Land | Improvement |
|---|---|---|---|---|
| 2025 | $2,654 | $105,625 | $14,675 | $90,950 |
| 2024 | -- | $78,300 | $12,325 | $65,975 |
| 2023 | $4,770 | $78,300 | $12,325 | $65,975 |
| 2022 | $4,770 | $78,300 | $12,325 | $65,975 |
| 2021 | $4,826 | $78,300 | $12,325 | $65,975 |
| 2020 | $4,848 | $66,900 | $12,325 | $54,575 |
| 2019 | $4,848 | $66,900 | $12,325 | $54,575 |
| 2018 | $4,848 | $66,900 | $12,325 | $54,575 |
| 2017 | $2,750 | $66,900 | $12,325 | $54,575 |
| 2016 | $2,853 | $65,275 | $0 | $0 |
| 2014 | $2,853 | $65,275 | $0 | $0 |
Source: Public Records
Map
Nearby Homes
- 4572 Princeton Rd
- 4678 Chickasaw Rd
- 316 Vescovo Dr
- 4501 Minden Rd
- 540 Berclair Rd
- 293 Cecilia Dr
- 4750 Sequoia Rd
- 4766 Chickasaw Rd
- 4525 Barfield Rd
- 441 Waring Rd
- 354 Avon Rd
- 566 Read St
- 4336 Hilldale Ave
- 240 Avon Rd
- 4321 Charleswood Ave
- 4565 Normandy Rd
- 101 N Grove Park Rd
- 4297 Sequoia Rd
- 4308 Hilldale Ave
- 91 N Grove Park Rd
- 369 N Perkins Rd
- 379 N Perkins Rd
- 4585 Sequoia Rd
- 355 N Perkins Rd
- 4577 Sequoia Rd
- 397 N Perkins Rd
- 360 Sequoia Cove
- 345 N Perkins Rd
- 4569 Sequoia Rd
- 360 N Perkins Rd
- 4586 Sequoia Rd
- 360 N Perkins Rd
- 378 N Perkins Rd
- 354 Sequoia Cove
- 403 N Perkins Rd
- 4578 Sequoia Rd
- 4561 Sequoia Rd
- 366 Sequoia Cove
- 394 N Perkins Rd
- 350 N Perkins Rd
Your Personal Tour Guide
Ask me questions while you tour the home.