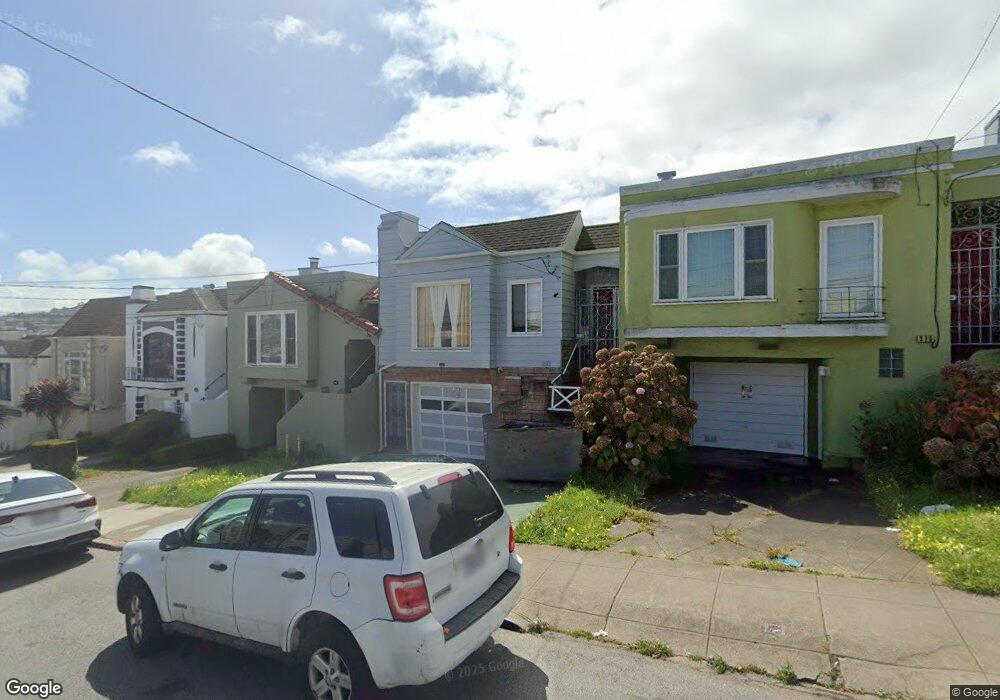
369 Niagara Ave San Francisco, CA 94112
Outer Mission NeighborhoodEstimated Value: $1,119,000 - $1,201,000
--
Bed
1
Bath
1,260
Sq Ft
$914/Sq Ft
Est. Value
About This Home
This home is located at 369 Niagara Ave, San Francisco, CA 94112 and is currently estimated at $1,151,376, approximately $913 per square foot. 369 Niagara Ave is a home located in San Francisco County with nearby schools including Longfellow Elementary School, Denman (James) Middle School, and Leadership High School.
Ownership History
Date
Name
Owned For
Owner Type
Purchase Details
Closed on
Dec 18, 2012
Sold by
Alonzo Judy A
Bought by
Alonzo Judy A
Current Estimated Value
Home Financials for this Owner
Home Financials are based on the most recent Mortgage that was taken out on this home.
Original Mortgage
$375,000
Outstanding Balance
$68,596
Interest Rate
3.27%
Mortgage Type
New Conventional
Estimated Equity
$1,082,780
Purchase Details
Closed on
Jul 16, 2009
Sold by
Alonzo Judy A
Bought by
Alonzo Judy A
Home Financials for this Owner
Home Financials are based on the most recent Mortgage that was taken out on this home.
Original Mortgage
$417,000
Interest Rate
5.59%
Mortgage Type
New Conventional
Purchase Details
Closed on
Feb 2, 2005
Sold by
Alonzo Judy A
Bought by
Alonzo Judy A
Purchase Details
Closed on
Aug 3, 2001
Sold by
Tse Yiu Lam and Tse Po Chun
Bought by
Alonzo Judy A
Home Financials for this Owner
Home Financials are based on the most recent Mortgage that was taken out on this home.
Original Mortgage
$395,950
Interest Rate
8.25%
Purchase Details
Closed on
Dec 22, 1994
Sold by
Tse Yiu Lam and Tse Po Chun
Bought by
Tse Yiu Lam and Tse Po Chun
Create a Home Valuation Report for This Property
The Home Valuation Report is an in-depth analysis detailing your home's value as well as a comparison with similar homes in the area
Home Values in the Area
Average Home Value in this Area
Purchase History
| Date | Buyer | Sale Price | Title Company |
|---|---|---|---|
| Alonzo Judy A | -- | Accommodation | |
| Alonzo Judy A | -- | Lsi Title Company | |
| Alonzo Judy A | -- | None Available | |
| Alonzo Judy A | -- | Ticor Title Insurance Co | |
| Alonzo Judy A | -- | -- | |
| Alonzo Judy A | $495,000 | Old Republic Title Company | |
| Tse Yiu Lam | -- | -- | |
| Tse Yui Lam | -- | -- |
Source: Public Records
Mortgage History
| Date | Status | Borrower | Loan Amount |
|---|---|---|---|
| Open | Alonzo Judy A | $375,000 | |
| Closed | Alonzo Judy A | $417,000 | |
| Closed | Alonzo Judy A | $395,950 | |
| Closed | Alonzo Judy A | $99,000 |
Source: Public Records
Tax History Compared to Growth
Tax History
| Year | Tax Paid | Tax Assessment Tax Assessment Total Assessment is a certain percentage of the fair market value that is determined by local assessors to be the total taxable value of land and additions on the property. | Land | Improvement |
|---|---|---|---|---|
| 2025 | $9,105 | $731,242 | $438,748 | $292,494 |
| 2024 | $9,105 | $716,905 | $430,146 | $286,759 |
| 2023 | $8,961 | $702,849 | $421,712 | $281,137 |
| 2022 | $8,779 | $689,069 | $413,444 | $275,625 |
| 2021 | $8,619 | $675,559 | $405,338 | $270,221 |
| 2020 | $8,670 | $668,633 | $401,182 | $267,451 |
| 2019 | $8,374 | $655,523 | $393,316 | $262,207 |
| 2018 | $8,091 | $642,670 | $385,604 | $257,066 |
| 2017 | $7,696 | $630,070 | $378,044 | $252,026 |
| 2016 | $7,554 | $617,717 | $370,632 | $247,085 |
| 2015 | $7,458 | $608,439 | $365,065 | $243,374 |
| 2014 | $7,261 | $596,521 | $357,914 | $238,607 |
Source: Public Records
Map
Nearby Homes
- 214 Louisburg St
- 115 Ottawa Ave
- 57 Niagara Ave
- 841 Geneva Ave
- 841 Ocean Ave
- 5020 Mission St Unit 1
- 5290 Mission St
- 5254 Mission St
- 5306-5308 Mission St
- 52 Rolph St
- 21 Hollywood Ct
- 5000 Summit St
- 108 Naglee Ave
- 4871 Mission St
- 26 Valerton Ct
- 4851 Mission St Unit 1
- 4845 Mission St
- 150 France Ave
- 63 Minerva St
- 528 London St
- 363 Niagara Ave
- 375 Niagara Ave
- 379 Niagara Ave
- 357 Niagara Ave
- 385 Niagara Ave
- 351 Niagara Ave
- 168 Shawnee Ave
- 162 Shawnee Ave
- 174 Shawnee Ave
- 156 Shawnee Ave
- 180 Shawnee Ave
- 345 Niagara Ave
- 2401 San Jose Ave
- 186 Shawnee Ave
- 150 Shawnee Ave
- 339 Niagara Ave
- 146 Shawnee Ave
- 192 Shawnee Ave
- 370 Niagara Ave
- 366 Niagara Ave