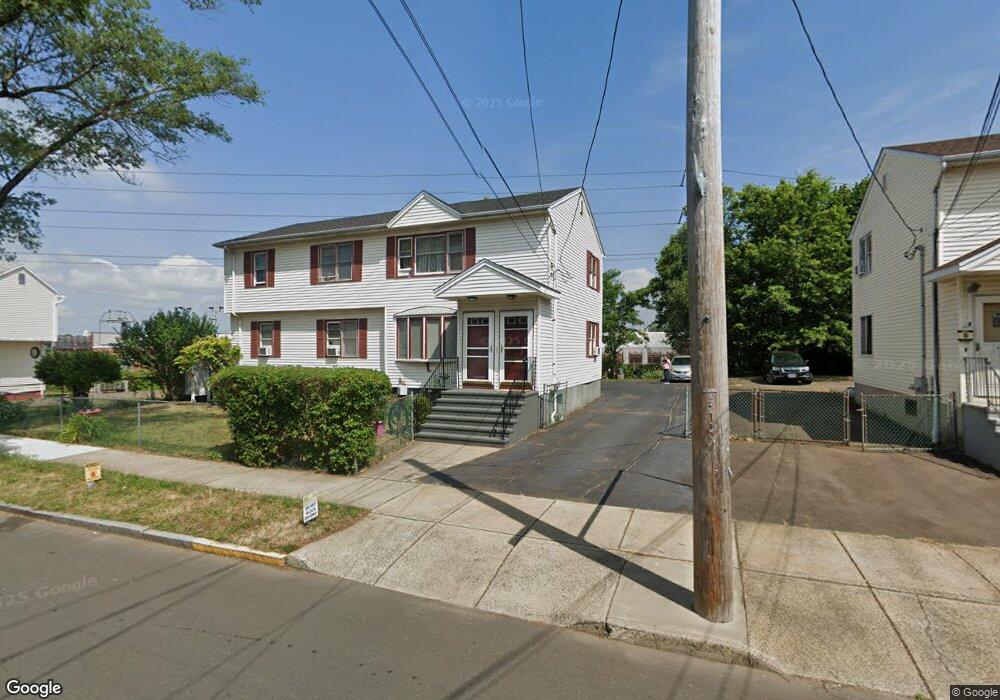
369 Peck St New Haven, CT 06513
Fair Haven NeighborhoodEstimated Value: $352,341 - $460,000
6
Beds
5
Baths
2,199
Sq Ft
$186/Sq Ft
Est. Value
About This Home
This home is located at 369 Peck St, New Haven, CT 06513 and is currently estimated at $409,835, approximately $186 per square foot. 369 Peck St is a home located in New Haven County with nearby schools including Clinton Avenue School, Elm City College Preparatory School, and Booker T. Washington Academy.
Ownership History
Date
Name
Owned For
Owner Type
Purchase Details
Closed on
Nov 13, 1995
Sold by
Corp For Urban Homeown
Bought by
Ortiz Evenilda and Colon Eric J
Current Estimated Value
Home Financials for this Owner
Home Financials are based on the most recent Mortgage that was taken out on this home.
Original Mortgage
$27,000
Interest Rate
7.47%
Create a Home Valuation Report for This Property
The Home Valuation Report is an in-depth analysis detailing your home's value as well as a comparison with similar homes in the area
Home Values in the Area
Average Home Value in this Area
Purchase History
| Date | Buyer | Sale Price | Title Company |
|---|---|---|---|
| Ortiz Evenilda | $130,000 | -- |
Source: Public Records
Mortgage History
| Date | Status | Borrower | Loan Amount |
|---|---|---|---|
| Open | Ortiz Evenilda | $85,000 | |
| Closed | Ortiz Evenilda | $27,000 | |
| Closed | Ortiz Evenilda | $104,000 | |
| Closed | Ortiz Evenilda | $27,000 |
Source: Public Records
Tax History Compared to Growth
Tax History
| Year | Tax Paid | Tax Assessment Tax Assessment Total Assessment is a certain percentage of the fair market value that is determined by local assessors to be the total taxable value of land and additions on the property. | Land | Improvement |
|---|---|---|---|---|
| 2025 | $6,076 | $154,210 | $24,920 | $129,290 |
| 2024 | $5,937 | $154,210 | $24,920 | $129,290 |
| 2023 | $5,737 | $154,210 | $24,920 | $129,290 |
| 2022 | $6,130 | $154,210 | $24,920 | $129,290 |
| 2021 | $3,840 | $87,500 | $19,950 | $67,550 |
| 2020 | $3,840 | $87,500 | $19,950 | $67,550 |
| 2019 | $3,761 | $87,500 | $19,950 | $67,550 |
| 2018 | $3,761 | $87,500 | $19,950 | $67,550 |
| 2017 | $3,385 | $87,500 | $19,950 | $67,550 |
| 2016 | $2,987 | $71,890 | $13,300 | $58,590 |
| 2015 | $2,987 | $71,890 | $13,300 | $58,590 |
| 2014 | $2,987 | $71,890 | $13,300 | $58,590 |
Source: Public Records
Map
Nearby Homes