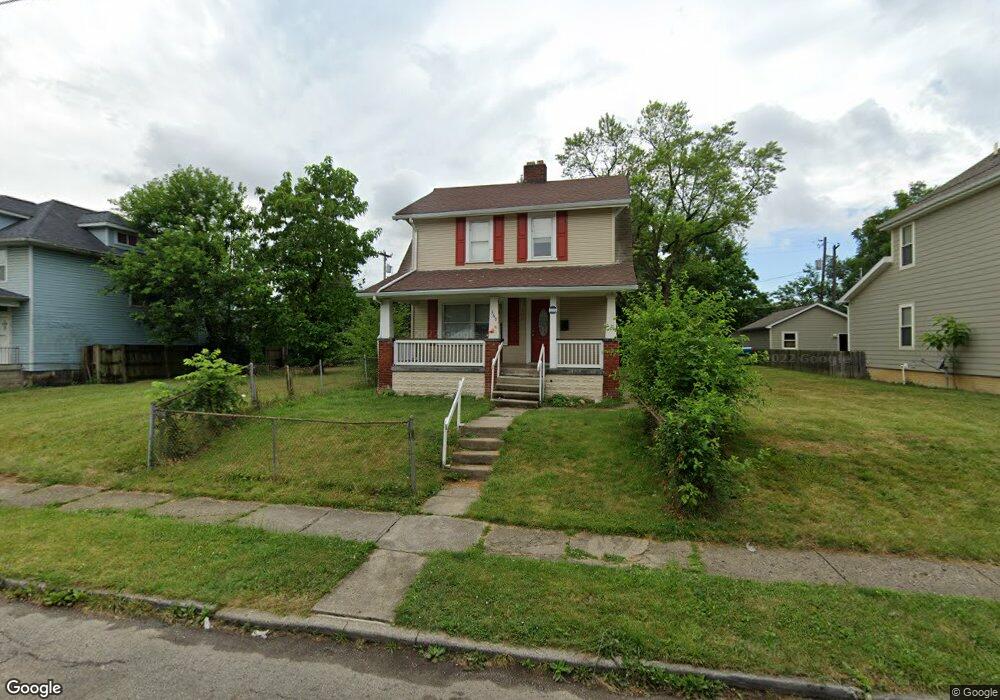
369 S Richardson Ave Columbus, OH 43204
Central Hilltop NeighborhoodEstimated Value: $130,508 - $196,000
2
Beds
1
Bath
1,364
Sq Ft
$114/Sq Ft
Est. Value
About This Home
This home is located at 369 S Richardson Ave, Columbus, OH 43204 and is currently estimated at $156,127, approximately $114 per square foot. 369 S Richardson Ave is a home located in Franklin County with nearby schools including Burroughs Elementary School, Hilltonia Middle School, and Briggs High School.
Ownership History
Date
Name
Owned For
Owner Type
Purchase Details
Closed on
Sep 5, 2017
Sold by
Warren Susanna K
Bought by
Lyons Kevin R
Current Estimated Value
Purchase Details
Closed on
Mar 22, 2016
Sold by
City Of Columbus Ohio
Bought by
Warren Susanna K
Purchase Details
Closed on
Mar 27, 2012
Sold by
Leonard Edward
Bought by
City Of Columbus
Purchase Details
Closed on
Feb 4, 2008
Sold by
Sovereign Bank
Bought by
Soto Gilbert
Purchase Details
Closed on
Sep 18, 2007
Sold by
Gildea Donald G and Us Bank Na
Bought by
Sovereign Bank
Purchase Details
Closed on
May 2, 2000
Sold by
Gildea Donald G and Gildea Mary L
Bought by
Gildea Donald G
Home Financials for this Owner
Home Financials are based on the most recent Mortgage that was taken out on this home.
Original Mortgage
$30,400
Interest Rate
8.18%
Purchase Details
Closed on
May 18, 1978
Bought by
Gildea Donald G
Create a Home Valuation Report for This Property
The Home Valuation Report is an in-depth analysis detailing your home's value as well as a comparison with similar homes in the area
Home Values in the Area
Average Home Value in this Area
Purchase History
| Date | Buyer | Sale Price | Title Company |
|---|---|---|---|
| Lyons Kevin R | $38,700 | None Available | |
| Warren Susanna K | -- | None Available | |
| City Of Columbus | $2,288 | None Available | |
| Soto Gilbert | $3,500 | Talon Group | |
| Sovereign Bank | $26,000 | None Available | |
| Gildea Donald G | -- | Hummel Title Agency Inc | |
| Gildea Donald G | $34,900 | -- |
Source: Public Records
Mortgage History
| Date | Status | Borrower | Loan Amount |
|---|---|---|---|
| Previous Owner | Gildea Donald G | $30,400 |
Source: Public Records
Tax History Compared to Growth
Tax History
| Year | Tax Paid | Tax Assessment Tax Assessment Total Assessment is a certain percentage of the fair market value that is determined by local assessors to be the total taxable value of land and additions on the property. | Land | Improvement |
|---|---|---|---|---|
| 2024 | $1,767 | $36,440 | $5,570 | $30,870 |
| 2023 | $1,710 | $36,435 | $5,565 | $30,870 |
| 2022 | $857 | $15,020 | $1,790 | $13,230 |
| 2021 | $925 | $15,020 | $1,790 | $13,230 |
| 2020 | $860 | $15,020 | $1,790 | $13,230 |
| 2019 | $767 | $12,640 | $1,470 | $11,170 |
| 2018 | $268 | $8,860 | $1,470 | $7,390 |
| 2017 | $551 | $8,860 | $1,470 | $7,390 |
| 2016 | $0 | $13,550 | $4,660 | $8,890 |
| 2015 | -- | $13,550 | $4,660 | $8,890 |
| 2014 | $25 | $13,550 | $4,660 | $8,890 |
| 2013 | $25 | $13,545 | $4,655 | $8,890 |
Source: Public Records
Map
Nearby Homes
- 274 S Richardson Ave
- 310 S Ogden Ave
- 350 S Ogden Ave
- 397 S Burgess Ave
- 405 S Burgess Ave
- 238 S Richardson Ave
- 232 S Burgess Ave
- 365 S Ogden Ave
- 349 S Eureka Ave
- 334 S Warren Ave
- 224 S Terrace Ave
- 327-329 S Wayne Ave
- 337 S Wayne Ave
- 418 S Warren Ave
- 219 S Ogden Ave
- 471 S Terrace Ave Unit 473
- 426 S Eureka Ave
- 444 S Warren Ave
- 448 S Warren Ave
- 262 S Harris Ave
- 365 S Richardson Ave
- 361 S Richardson Ave
- 381 S Richardson Ave
- 370 S Richardson Ave
- 357 S Richardson Ave
- 353 S Richardson Ave
- 378 S Richardson Ave
- 349 S Richardson Ave
- 362 S Richardson Ave
- 389 S Richardson Ave
- 386 S Richardson Ave
- 358 S Richardson Ave
- 345 S Richardson Ave
- 393 S Richardson Ave
- 354 S Richardson Ave
- 0 S Richardson Ave
- 370 S Burgess Ave
- 376 S Burgess Ave
- 366 S Burgess Ave
- 366 S Burgess Ave Unit 1