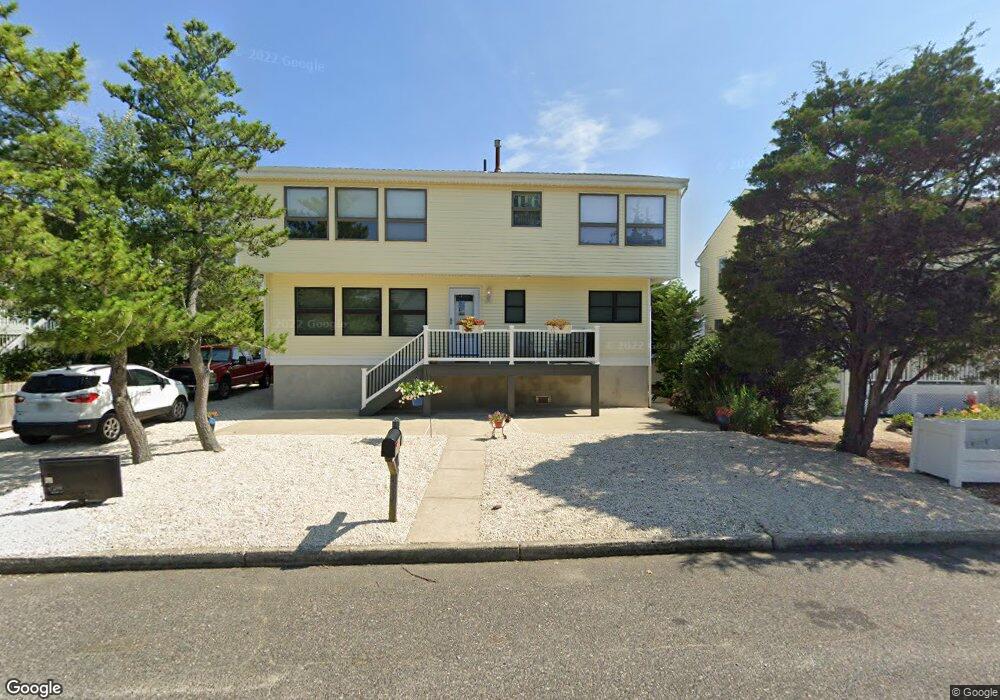
369 W 11th St Ship Bottom, NJ 08008
Long Beach Island NeighborhoodEstimated Value: $912,000 - $1,649,000
4
Beds
3
Baths
1,712
Sq Ft
$768/Sq Ft
Est. Value
About This Home
This home is located at 369 W 11th St, Ship Bottom, NJ 08008 and is currently estimated at $1,314,455, approximately $767 per square foot. 369 W 11th St is a home located in Ocean County with nearby schools including Ethel A. Jacobsen Elementary School, Long Beach Island Grade School, and Southern Regional Middle School.
Ownership History
Date
Name
Owned For
Owner Type
Purchase Details
Closed on
Mar 29, 2021
Sold by
Mullen Kelly and Estate Of Patricia L Wexler
Bought by
Mullen Kelly
Current Estimated Value
Purchase Details
Closed on
Mar 30, 1998
Sold by
Norris Dorothy R
Bought by
Wexler Gerson and Wexler Patricia L
Create a Home Valuation Report for This Property
The Home Valuation Report is an in-depth analysis detailing your home's value as well as a comparison with similar homes in the area
Home Values in the Area
Average Home Value in this Area
Purchase History
| Date | Buyer | Sale Price | Title Company |
|---|---|---|---|
| Mullen Kelly | -- | None Available | |
| Mullen Kelly | -- | None Listed On Document | |
| Wexler Gerson | $201,500 | -- |
Source: Public Records
Tax History Compared to Growth
Tax History
| Year | Tax Paid | Tax Assessment Tax Assessment Total Assessment is a certain percentage of the fair market value that is determined by local assessors to be the total taxable value of land and additions on the property. | Land | Improvement |
|---|---|---|---|---|
| 2025 | $6,708 | $556,700 | $343,000 | $213,700 |
| 2024 | $6,396 | $556,700 | $343,000 | $213,700 |
| 2023 | $5,895 | $556,700 | $343,000 | $213,700 |
| 2022 | $5,895 | $556,700 | $343,000 | $213,700 |
| 2021 | $5,172 | $556,700 | $343,000 | $213,700 |
| 2020 | $5,884 | $556,700 | $343,000 | $213,700 |
| 2019 | $5,890 | $556,700 | $343,000 | $213,700 |
| 2018 | $5,901 | $556,700 | $343,000 | $213,700 |
| 2017 | $5,517 | $556,700 | $343,000 | $213,700 |
| 2016 | $5,023 | $476,300 | $289,100 | $187,200 |
| 2015 | $4,894 | $413,300 | $289,100 | $124,200 |
| 2014 | $4,210 | $413,300 | $289,100 | $124,200 |
Source: Public Records
Map
Nearby Homes
- 369 W 10th St
- 379 W 8th St Unit 6
- 1306 Barnegat Ave
- 328 W 6th St
- 615 Barnegat Ave
- 2 Northeast Dr
- 2561 2nd St
- 4 First
- 4 1st St
- 605 Long Beach Blvd
- 1412 Long Beach Boulevard U-A
- 1001 Ocean Ave Unit 1012
- 1001 Ocean Ave Unit C1001
- 111 W 18th St Unit 2
- 249 S 2nd St
- 401 Boulevard Unit 306
- 401 Boulevard Unit 506
- 401 Boulevard Unit 508
- 401 Boulevard Unit 503
- 401 Boulevard Unit 201