Estimated Value: $772,000 - $1,322,000
8
Beds
4
Baths
3,808
Sq Ft
$291/Sq Ft
Est. Value
About This Home
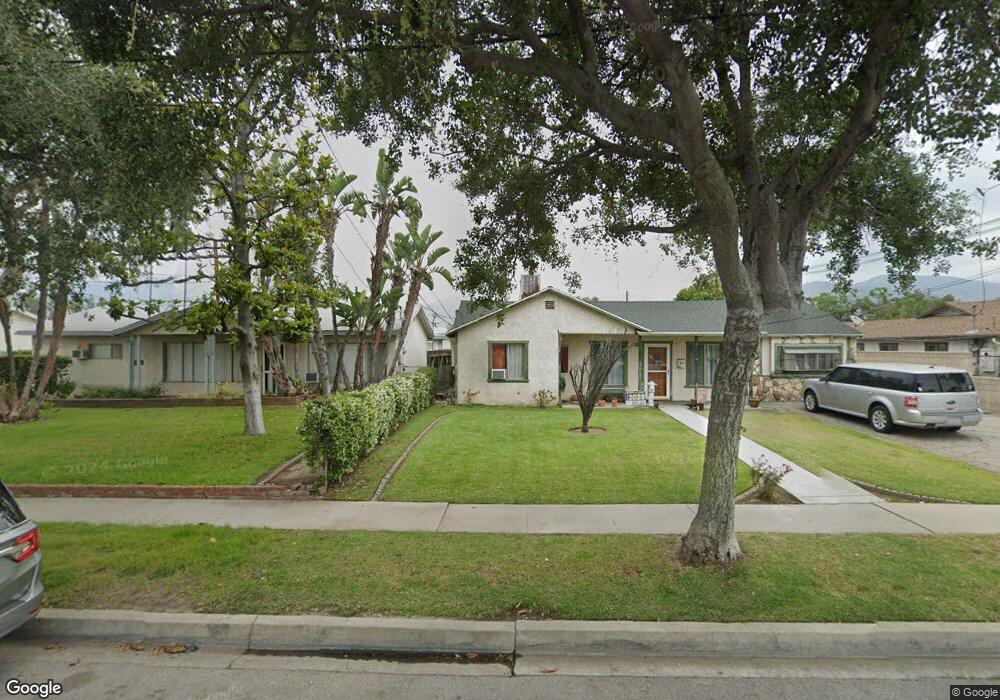
This home is located at 369 W 2nd St, Azusa, CA 91702 and is currently estimated at $1,108,667, approximately $291 per square foot. 369 W 2nd St is a home located in Los Angeles County with nearby schools including Gladstone High School, Christbridge Academy, and St. Frances of Rome School.
Ownership History
Date
Name
Owned For
Owner Type
Purchase Details
Closed on
Jul 8, 2016
Sold by
Separate Alvarado Konzen Susan and Separate Susan Alvarado Konzen
Bought by
Proper Alvarado Susan M and Proper Susan Alvarado Separate
Current Estimated Value
Purchase Details
Closed on
Apr 17, 2007
Sold by
Alvarado Susan
Bought by
Separate Alvarado Konzen Susan and Separate Susan Alvarado Konzen
Purchase Details
Closed on
Aug 29, 2006
Sold by
Swallow Susan A
Bought by
Alvarado Susan
Home Financials for this Owner
Home Financials are based on the most recent Mortgage that was taken out on this home.
Original Mortgage
$175,000
Interest Rate
6.56%
Mortgage Type
New Conventional
Purchase Details
Closed on
Jul 18, 2006
Sold by
Swallow Scott N and Swallow Susan A
Bought by
Swallow Susan A
Home Financials for this Owner
Home Financials are based on the most recent Mortgage that was taken out on this home.
Original Mortgage
$175,000
Interest Rate
6.56%
Mortgage Type
New Conventional
Create a Home Valuation Report for This Property
The Home Valuation Report is an in-depth analysis detailing your home's value as well as a comparison with similar homes in the area
Home Values in the Area
Average Home Value in this Area
Purchase History
| Date | Buyer | Sale Price | Title Company |
|---|---|---|---|
| Proper Alvarado Susan M | -- | None Available | |
| Separate Alvarado Konzen Susan | -- | None Available | |
| Alvarado Susan | -- | American Coast Title | |
| Alvarado Susan | -- | American Coast Title | |
| Swallow Susan A | -- | None Available |
Source: Public Records
Mortgage History
| Date | Status | Borrower | Loan Amount |
|---|---|---|---|
| Previous Owner | Alvarado Susan | $175,000 |
Source: Public Records
Tax History
| Year | Tax Paid | Tax Assessment Tax Assessment Total Assessment is a certain percentage of the fair market value that is determined by local assessors to be the total taxable value of land and additions on the property. | Land | Improvement |
|---|---|---|---|---|
| 2025 | $4,534 | $297,843 | $188,115 | $109,728 |
| 2024 | $4,534 | $292,004 | $184,427 | $107,577 |
| 2023 | $4,427 | $286,279 | $180,811 | $105,468 |
| 2022 | $4,371 | $280,666 | $177,266 | $103,400 |
| 2021 | $4,251 | $275,164 | $173,791 | $101,373 |
| 2020 | $4,181 | $272,343 | $172,009 | $100,334 |
| 2019 | $4,123 | $267,004 | $168,637 | $98,367 |
| 2018 | $3,868 | $261,770 | $165,331 | $96,439 |
| 2016 | $3,671 | $251,608 | $158,912 | $92,696 |
| 2015 | $3,615 | $247,829 | $156,525 | $91,304 |
| 2014 | $3,432 | $242,975 | $153,459 | $89,516 |
Source: Public Records
Map
Nearby Homes
- 236 N San Gabriel Ave
- 227 N Azusa Ave
- 605 W 1st St
- 412 N San Gabriel Ave
- 543 N Angeleno Ave
- 509 N Alameda Ave
- 205 S Vernon Ave
- 543 N Barbara Ave
- 717 N Angeleno Ave
- 302 S Aspan Ave
- 539 N Pasadena Ave
- 624 N Pasadena Ave
- 840 N Azusa Ave Unit 144
- 828 N Angeleno Ave
- 684 E Lee Place
- 644 E Lee Place
- 17140 E Orkney St
- 5844 Glenfinnan Ave
- 17104 E Orkney St
- 17049 E Orkney St
Your Personal Tour Guide
Ask me questions while you tour the home.