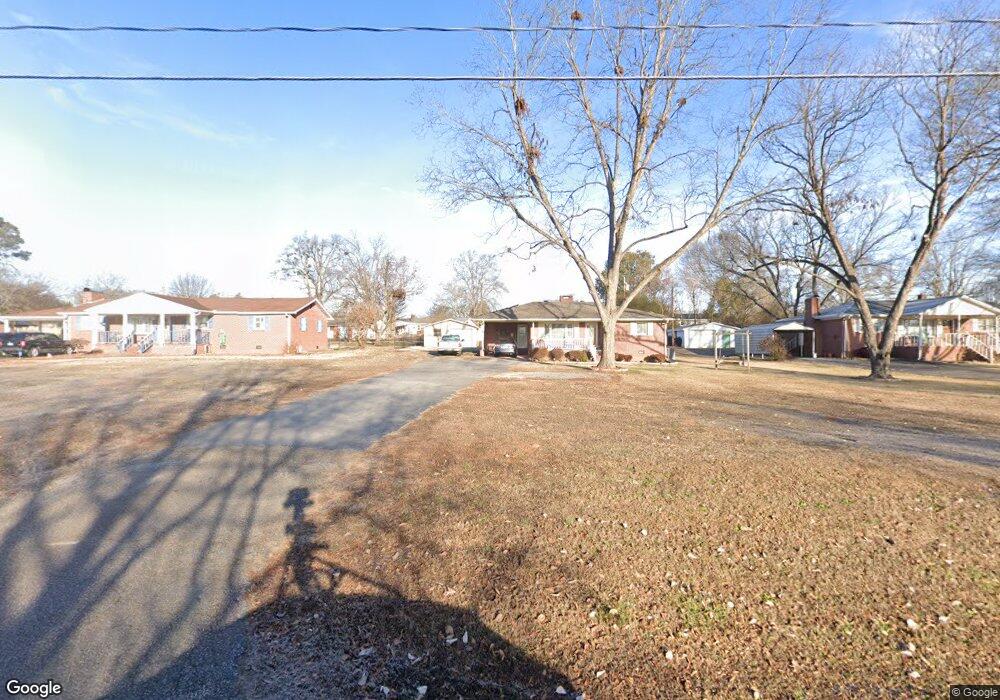
369 Wingo Rd Roebuck, SC 29376
Estimated Value: $135,000 - $202,000
2
Beds
1
Bath
1,121
Sq Ft
$148/Sq Ft
Est. Value
About This Home
This home is located at 369 Wingo Rd, Roebuck, SC 29376 and is currently estimated at $165,788, approximately $147 per square foot. 369 Wingo Rd is a home located in Spartanburg County with nearby schools including Dorman High School Freshman Campus, Dorman High School, and Eddlemon Adventist School.
Ownership History
Date
Name
Owned For
Owner Type
Purchase Details
Closed on
Oct 11, 2022
Sold by
Guy Anita L
Bought by
Blanton Barbara K and Blanton Rudy D
Current Estimated Value
Purchase Details
Closed on
Nov 13, 2020
Sold by
Blanton Barbara K and Evans Angela A
Bought by
Blanton Barbara K and Blanton Rudy D
Purchase Details
Closed on
Jun 28, 2019
Sold by
Blanton Barbara K and Lynch Barbara K
Bought by
Blanton Barbara K and Evans Angela A
Purchase Details
Closed on
Aug 18, 2001
Sold by
Lynch Barbara K
Bought by
Lynch Barbara K
Create a Home Valuation Report for This Property
The Home Valuation Report is an in-depth analysis detailing your home's value as well as a comparison with similar homes in the area
Home Values in the Area
Average Home Value in this Area
Purchase History
| Date | Buyer | Sale Price | Title Company |
|---|---|---|---|
| Blanton Barbara K | -- | -- | |
| Blanton Barbara K | -- | -- | |
| Blanton Barbara K | -- | None Available | |
| Blanton Barbara K | -- | None Available | |
| Lynch Barbara K | -- | -- |
Source: Public Records
Tax History
| Year | Tax Paid | Tax Assessment Tax Assessment Total Assessment is a certain percentage of the fair market value that is determined by local assessors to be the total taxable value of land and additions on the property. | Land | Improvement |
|---|---|---|---|---|
| 2022 | $292 | $3,224 | $555 | $2,669 |
| 2021 | $290 | $3,224 | $555 | $2,669 |
| 2020 | $278 | $3,224 | $555 | $2,669 |
| 2019 | $272 | $3,224 | $555 | $2,669 |
| 2018 | $273 | $3,224 | $555 | $2,669 |
| 2017 | $197 | $2,803 | $517 | $2,286 |
| 2016 | $200 | $2,803 | $517 | $2,286 |
| 2015 | $193 | $2,804 | $517 | $2,287 |
| 2014 | $184 | $2,804 | $517 | $2,287 |
Source: Public Records
Map
Nearby Homes
- 1156 Kaden Ct
- 1152 Kaden Ct
- 1149 Kaden Ct
- 1145 Kaden Ct
- 1144 Kaden Ct
- 1141 Kaden Ct
- 1140 Kaden Ct
- 1132 Kaden Ct
- 1128 Kaden Ct
- 627 Pauline Ln
- 554 Vault Way
- 502 Vault Way
- 3917 S Church Street Extension
- 324 Winston Ln
- 100 Reedy St
- 0000 U S 221 Hwy N
- 2011 Hillman Way
- 2013 Hillman Way
- 236 Basswood Dr
- 140 Eastbrook Terrace
Your Personal Tour Guide
Ask me questions while you tour the home.