


36913 Newark Blvd Unit C Newark, CA 94560
Estimated payment $4,849/month
Highlights
- Gunite Pool
- Contemporary Architecture
- Tile Flooring
- 122,839 Sq Ft lot
- Laundry closet
- Forced Air Heating and Cooling System
About This Home
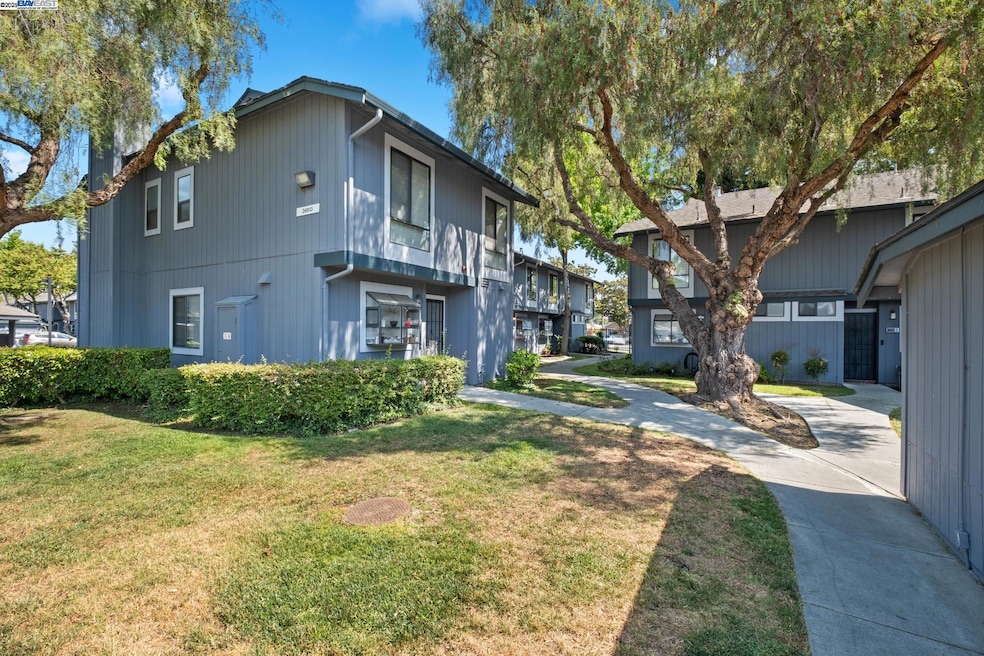
Welcome to this beautifully refreshed townhome located in the Foxwood community in Newark CA. This spacious town home has 1,330 Sqft. of living space with 3 bedrooms and 2.5 baths. The home has new interior texture, paint and recessed lighting. The kitchen has white cabinets with pull hardware and new quartz counter tops and a new stainless steel sink and faucet. The baths have been refreshed with new counters and bath fixtures. New premium carpeting on stairs as well as new lighting in bedrooms This property has an open floorplan, downstairs half bath, inside laundry and air conditioning. 1 covered parking as well as an additional parking space. The HOA amenities include trash removal, water and pool access. This home has a great location which is near schools, parks, shopping and freeway access.
Listing Agent
Thomas Connolly
License #01422975 Listed on: 06/10/2025
Townhouse Details
Home Type
- Townhome
Est. Annual Taxes
- $6,039
Year Built
- Built in 1987
Lot Details
- 2.82 Acre Lot
- East Facing Home
HOA Fees
- $549 Monthly HOA Fees
Parking
- Covered Parking
Home Design
- Contemporary Architecture
- Composition Shingle Roof
- Wood Siding
- Stucco
Interior Spaces
- 2-Story Property
- Family Room with Fireplace
Kitchen
- Electric Cooktop
- Dishwasher
Flooring
- Laminate
- Tile
Bedrooms and Bathrooms
- 3 Bedrooms
Laundry
- Laundry closet
- Dryer
- Washer
Pool
- Gunite Pool
- Fence Around Pool
Utilities
- Forced Air Heating and Cooling System
- 220 Volts in Kitchen
- Gas Water Heater
Listing and Financial Details
- Assessor Parcel Number 92A259535
Community Details
Overview
- Association fees include common area maintenance, trash, water/sewer
- Foxwood Townhomes Association, Phone Number (925) 743-3080
- Foxwood Subdivision
Recreation
- Community Pool
Map
Home Values in the Area
Average Home Value in this Area
Tax History
| Year | Tax Paid | Tax Assessment Tax Assessment Total Assessment is a certain percentage of the fair market value that is determined by local assessors to be the total taxable value of land and additions on the property. | Land | Improvement |
|---|---|---|---|---|
| 2025 | $6,039 | $475,704 | $142,171 | $333,533 |
| 2024 | $6,039 | $466,378 | $139,384 | $326,994 |
| 2023 | $5,871 | $457,234 | $136,651 | $320,583 |
| 2022 | $5,790 | $448,270 | $133,972 | $314,298 |
| 2021 | $5,653 | $439,483 | $131,346 | $308,137 |
| 2020 | $5,548 | $434,980 | $130,000 | $304,980 |
| 2019 | $5,471 | $426,451 | $127,451 | $299,000 |
| 2018 | $5,389 | $418,089 | $124,952 | $293,137 |
| 2017 | $5,252 | $409,891 | $122,502 | $287,389 |
| 2016 | $5,194 | $401,854 | $120,100 | $281,754 |
| 2015 | $5,176 | $395,818 | $118,296 | $277,522 |
| 2014 | $4,743 | $370,000 | $111,000 | $259,000 |
Property History
| Date | Event | Price | Change | Sq Ft Price |
|---|---|---|---|---|
| 09/11/2025 09/11/25 | Pending | -- | -- | -- |
| 08/15/2025 08/15/25 | Price Changed | $719,000 | 0.0% | $541 / Sq Ft |
| 08/15/2025 08/15/25 | For Sale | $719,000 | +2.9% | $541 / Sq Ft |
| 08/03/2025 08/03/25 | Off Market | $699,000 | -- | -- |
| 06/10/2025 06/10/25 | For Sale | $699,000 | -- | $526 / Sq Ft |
Purchase History
| Date | Type | Sale Price | Title Company |
|---|---|---|---|
| Grant Deed | $341,000 | Alliance Title Company | |
| Grant Deed | $240,000 | Fidelity National Title Co |
Mortgage History
| Date | Status | Loan Amount | Loan Type |
|---|---|---|---|
| Open | $215,000 | New Conventional | |
| Closed | $238,859 | New Conventional | |
| Closed | $272,700 | Unknown | |
| Previous Owner | $240,000 | Unknown | |
| Previous Owner | $230,000 | No Value Available | |
| Previous Owner | $30,000 | Unknown | |
| Closed | $51,100 | No Value Available |
Source: Bay East Association of REALTORS®
MLS Number: 41100862
APN: 092A-2595-035-00
Disclaimer: Certain information contained herein is derived from information provided by parties other than Homes.com. All information provided is deemed reliable, but is not guaranteed to be accurate and should be independently verified.
![]() Bay East ©2025. CCAR ©2025. bridgeMLS ©2025. Information Deemed Reliable But Not Guaranteed. This information is being provided by the Bay East MLS, or CCAR MLS, or bridgeMLS. The listings presented here may or may not be listed by the Broker/Agent operating this website. This information is intended for the personal use of consumers and may not be used for any purpose other than to identify prospective properties consumers may be interested in purchasing.
Bay East ©2025. CCAR ©2025. bridgeMLS ©2025. Information Deemed Reliable But Not Guaranteed. This information is being provided by the Bay East MLS, or CCAR MLS, or bridgeMLS. The listings presented here may or may not be listed by the Broker/Agent operating this website. This information is intended for the personal use of consumers and may not be used for any purpose other than to identify prospective properties consumers may be interested in purchasing.
- 6125 Thornton Ave Unit A
- 6245 Thornton Ave
- 6278 Dairy Ave
- 6433 Thornton Ave
- 36815 Hafner St
- 6364 Noel Ave
- 36706 Hafner St
- 6198 Civic Terrace Ave Unit A
- 36397 Dijon Dr
- 36976 Mulberry St
- 6416 Mayhews Landing Rd
- 6176 Thomas Ave
- 36523 Cherry St
- 6364 Thomas Ave
- 5879 Caleb Ct
- 6916 Graham Ave
- 36535 Mulberry St
- 37136 Magnolia St
- 37282 Magnolia St
- 5447 Saint Mark Ave