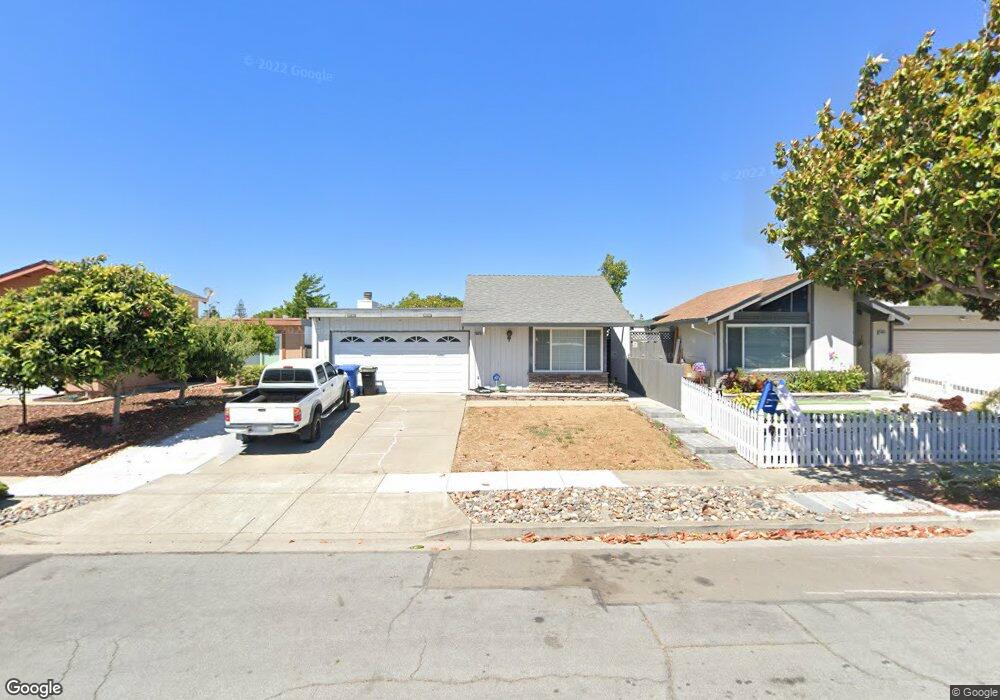
36918 Port Tidewood St Newark, CA 94560
Estimated Value: $1,113,000 - $1,199,000
3
Beds
2
Baths
1,450
Sq Ft
$797/Sq Ft
Est. Value
About This Home
This home is located at 36918 Port Tidewood St, Newark, CA 94560 and is currently estimated at $1,155,276, approximately $796 per square foot. 36918 Port Tidewood St is a home located in Alameda County with nearby schools including Newark Junior High School, Newark Memorial High School, and St. Edward School.
Ownership History
Date
Name
Owned For
Owner Type
Purchase Details
Closed on
Feb 12, 2016
Sold by
Arcangel Bradley M
Bought by
Arcangel Bradley M and Arcangel Michelle P
Current Estimated Value
Home Financials for this Owner
Home Financials are based on the most recent Mortgage that was taken out on this home.
Original Mortgage
$345,000
Outstanding Balance
$275,206
Interest Rate
3.97%
Mortgage Type
New Conventional
Estimated Equity
$880,070
Purchase Details
Closed on
Oct 20, 2011
Sold by
Festejo Adelmo J
Bought by
Arcangel Bradley M
Home Financials for this Owner
Home Financials are based on the most recent Mortgage that was taken out on this home.
Original Mortgage
$315,877
Interest Rate
4.01%
Mortgage Type
FHA
Create a Home Valuation Report for This Property
The Home Valuation Report is an in-depth analysis detailing your home's value as well as a comparison with similar homes in the area
Home Values in the Area
Average Home Value in this Area
Purchase History
| Date | Buyer | Sale Price | Title Company |
|---|---|---|---|
| Arcangel Bradley M | -- | Lawyers Title Company | |
| Arcangel Bradley M | $347,500 | North American Title Company |
Source: Public Records
Mortgage History
| Date | Status | Borrower | Loan Amount |
|---|---|---|---|
| Open | Arcangel Bradley M | $345,000 | |
| Closed | Arcangel Bradley M | $315,877 |
Source: Public Records
Tax History Compared to Growth
Tax History
| Year | Tax Paid | Tax Assessment Tax Assessment Total Assessment is a certain percentage of the fair market value that is determined by local assessors to be the total taxable value of land and additions on the property. | Land | Improvement |
|---|---|---|---|---|
| 2025 | $5,612 | $429,455 | $130,936 | $305,519 |
| 2024 | $5,612 | $420,900 | $128,370 | $299,530 |
| 2023 | $5,449 | $419,511 | $125,853 | $293,658 |
| 2022 | $5,367 | $404,286 | $123,386 | $287,900 |
| 2021 | $5,235 | $396,224 | $120,967 | $282,257 |
| 2020 | $5,129 | $399,092 | $119,727 | $279,365 |
| 2019 | $5,057 | $391,270 | $117,381 | $273,889 |
| 2018 | $4,978 | $383,601 | $115,080 | $268,521 |
| 2017 | $4,850 | $376,081 | $112,824 | $263,257 |
| 2016 | $4,792 | $368,707 | $110,612 | $258,095 |
| 2015 | $4,775 | $363,171 | $108,951 | $254,220 |
| 2014 | $4,642 | $356,058 | $106,817 | $249,241 |
Source: Public Records
Map
Nearby Homes
- 36720 Charles St
- 36686 Charles St
- 5113 Dupont Ave
- 5669 Civic Terrace Ave
- 37114 Dondero Way
- 5139 Dryden Ct
- 5912 Mayhews Landing Rd
- 5879 Caleb Ct
- 36202 Worthing Dr
- 5148 Ipswich Ct
- 36521 Cabrillo Dr
- 4737 Deadwood Dr
- 36347 Magellan Dr
- 36109 Dalewood Dr
- 37659 Granville Dr
- 6025 Radcliffe Ave
- 4637 Rothbury Common
- 4632 Balboa Way
- 5268 Keeler Ct
- 36139 San Pedro Dr
- 36876 Port Tidewood St
- 36932 Port Tidewood St
- 36915 Port Sailwood Dr
- 36854 Port Tidewood St
- 36937 Port Sailwood Dr
- 36883 Port Sailwood Dr
- 36954 Port Tidewood St
- 36861 Port Sailwood Dr
- 36959 Port Sailwood Dr
- 36832 Port Tidewood St
- 36909 Port Tidewood St
- 36921 Port Tidewood St
- 36887 Port Tidewood St
- 36849 Port Sailwood Dr
- 36943 Port Tidewood St
- 36865 Port Tidewood St
- 36816 Port Tidewood St
- 36963 Port Tidewood St
- 36827 Port Sailwood Dr
- 36843 Port Tidewood St