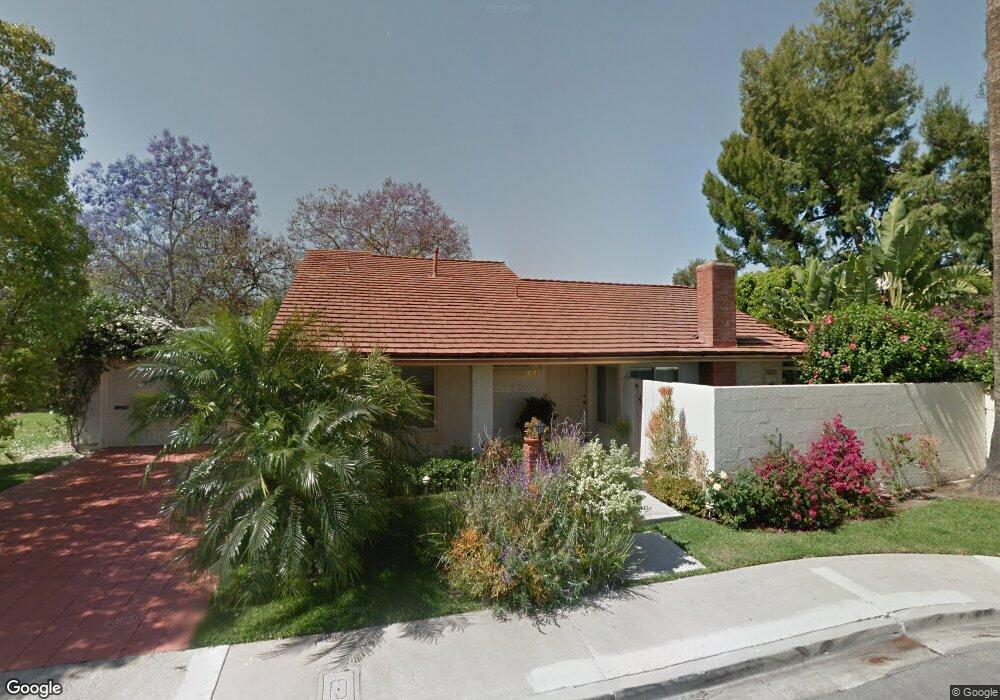
3692 Provincetown Ave Irvine, CA 92606
Walnut NeighborhoodEstimated Value: $1,311,664 - $1,497,000
2
Beds
2
Baths
1,458
Sq Ft
$981/Sq Ft
Est. Value
About This Home
This home is located at 3692 Provincetown Ave, Irvine, CA 92606 and is currently estimated at $1,430,916, approximately $981 per square foot. 3692 Provincetown Ave is a home located in Orange County with nearby schools including College Park Elementary School, Venado Middle School, and Irvine High School.
Ownership History
Date
Name
Owned For
Owner Type
Purchase Details
Closed on
Feb 26, 2021
Sold by
Temel Andrea B
Bought by
Temel Andrea B and The Temel Trust
Current Estimated Value
Purchase Details
Closed on
Aug 6, 2020
Sold by
Temel Andrea B and The Temel Trust
Bought by
Temel Andrea B
Home Financials for this Owner
Home Financials are based on the most recent Mortgage that was taken out on this home.
Original Mortgage
$200,000
Interest Rate
3%
Mortgage Type
New Conventional
Purchase Details
Closed on
Dec 20, 2002
Sold by
Temel Andrea B
Bought by
Temel Andrea B and Temel Trust
Home Financials for this Owner
Home Financials are based on the most recent Mortgage that was taken out on this home.
Original Mortgage
$175,000
Interest Rate
5.97%
Purchase Details
Closed on
Dec 21, 1995
Sold by
Temel Andrea B and Temel Andrea Beth
Bought by
Temel Andrea B
Create a Home Valuation Report for This Property
The Home Valuation Report is an in-depth analysis detailing your home's value as well as a comparison with similar homes in the area
Home Values in the Area
Average Home Value in this Area
Purchase History
| Date | Buyer | Sale Price | Title Company |
|---|---|---|---|
| Temel Andrea B | -- | Timios Title A Ca Corp | |
| Temel Andrea B | -- | Timios Title A Ca Corp | |
| Temel Andrea B | -- | -- | |
| Temel Andrea B | -- | Diversified Title & Escrow S | |
| Temel Andrea B | -- | -- |
Source: Public Records
Mortgage History
| Date | Status | Borrower | Loan Amount |
|---|---|---|---|
| Closed | Temel Andrea B | $200,000 | |
| Closed | Temel Andrea B | $175,000 |
Source: Public Records
Tax History
| Year | Tax Paid | Tax Assessment Tax Assessment Total Assessment is a certain percentage of the fair market value that is determined by local assessors to be the total taxable value of land and additions on the property. | Land | Improvement |
|---|---|---|---|---|
| 2025 | $4,609 | $439,581 | $307,603 | $131,978 |
| 2024 | $4,609 | $430,962 | $301,571 | $129,391 |
| 2023 | $4,489 | $422,512 | $295,658 | $126,854 |
| 2022 | $4,398 | $414,228 | $289,861 | $124,367 |
| 2021 | $4,295 | $406,106 | $284,177 | $121,929 |
| 2020 | $4,270 | $401,942 | $281,263 | $120,679 |
| 2019 | $4,174 | $394,061 | $275,748 | $118,313 |
| 2018 | $4,098 | $386,335 | $270,341 | $115,994 |
| 2017 | $4,012 | $378,760 | $265,040 | $113,720 |
| 2016 | $3,836 | $371,334 | $259,843 | $111,491 |
| 2015 | $3,725 | $365,757 | $255,940 | $109,817 |
| 2014 | $3,652 | $358,593 | $250,927 | $107,666 |
Source: Public Records
Map
Nearby Homes
- 3761 Provincetown Ave
- 14541 Savin Ave
- 3852 Uris Ct
- 14272 Saarinen Ct
- 14172 Moore Ct
- 14072 Picasso Ct
- 17 Rhode Island
- 24 Millstone Unit 137
- 4062 Escudero Dr
- 424 Deerfield Ave Unit 172
- 175 Zephyr Run Unit 175
- 280 Tustin Field Dr
- 328 Flyers Ln
- 390 Deerfield Ave Unit 125
- 369 Deerfield Ave Unit 35
- 374 Aviator Ln
- 14 Wakefield
- 4511 Charleville Cir
- 11 Pienza
- 40 Bolinas Unit 5
- 3682 Provincetown Ave
- 3702 Provincetown Ave
- 3706 Provincetown Ave
- 3672 Provincetown Ave
- 3712 Provincetown Ave
- 3662 Provincetown Ave
- 3701 Provincetown Ave
- 3732 Provincetown Ave
- 3656 Provincetown Ave
- 14492 Larch Ave
- 3742 Provincetown Ave
- 3722 Provincetown Ave
- 14491 Guama Ave
- 14482 Larch Ave
- 3711 Provincetown Ave
- 3746 Provincetown Ave
- 3695 Provincetown Ave
- 3652 Provincetown Ave
- 14501 Guama Ave
- 14492 Guama Ave
Your Personal Tour Guide
Ask me questions while you tour the home.