
Seller's Agent in 2015
Sally Ragan
T.N.G. Real Estate Consultants
(909) 938-7100
27 Total Sales
Estimated Value: $907,097 - $981,000
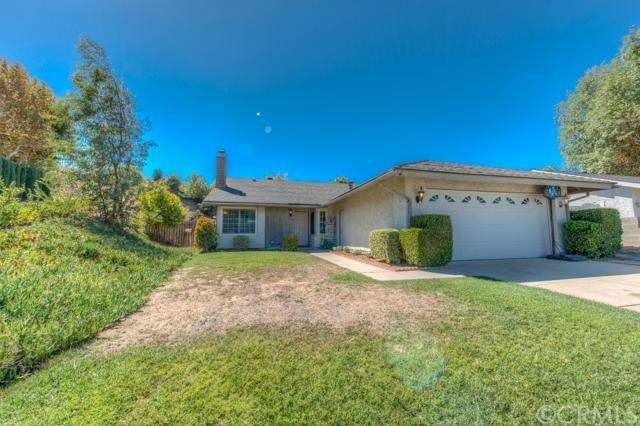
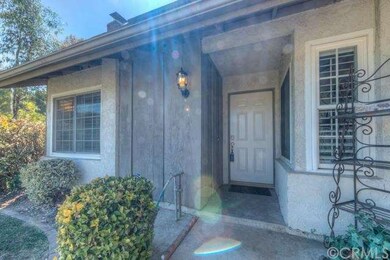
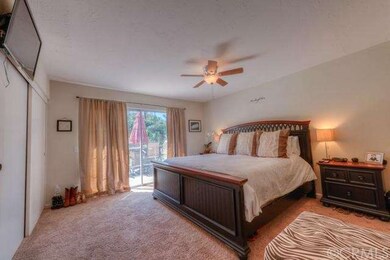
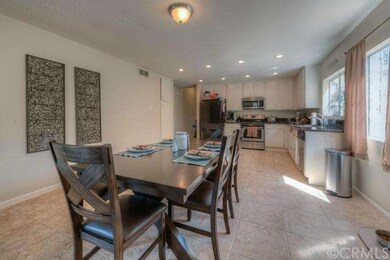
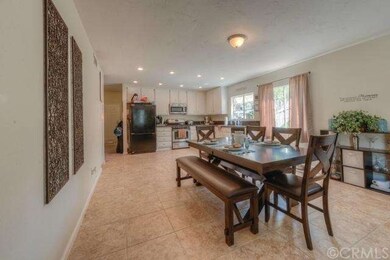
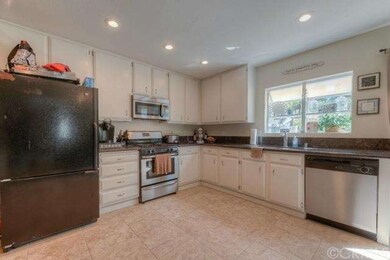
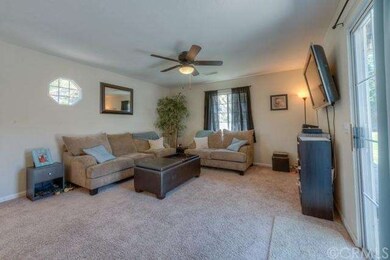
Just Reduced!!! This lovely Single Story Home has 4 Bedrooms, 2 bathrooms, with an open Floor plan to the Dining Area and Family Room, the kitchen has been remodeled with Granite Counter tops, Stainless Steel appliances, and a Garden Window, Ceramic Tile flooring in Kitchen, Dining Room, and Bathrooms, the Living Room has a fireplace, both bathrooms have been upgraded, newer windows & sliders, newer paint, Ceiling Fans, spacious backyard large enough for a pool & spa. Approximately 1,657 square feet. Bring your buyers to see this one!
Last Agent to Sell the Property
T.N.G. Real Estate Consultants License #01202768 Listed on: 12/29/2014
Last Buyer's Agent
Ann Hwu
American Global Asset Services License #01738143
| Date | Buyer | Sale Price | Title Company |
|---|---|---|---|
| Wang Hao | $476,000 | Chicago Title Co | |
| Quella Laurisa L | $380,000 | Premium Title Of Ca Inc | |
| Cove Capital Properties Llc | $280,500 | Orange Coast Title | |
| Deutsche Bank National Trust Company | $384,000 | Accommodation | |
| Lacap Mark | -- | Financial Title | |
| Lacap Mark | $282,000 | American Title Co | |
| Garcia Manuel | -- | -- |
| Date | Status | Borrower | Loan Amount |
|---|---|---|---|
| Open | Wang Hao | $285,000 | |
| Previous Owner | Wang Hao | $285,600 | |
| Previous Owner | Quella Laurisa L | $380,000 | |
| Previous Owner | Quella Laurisa L | $360,900 | |
| Previous Owner | Lacap Mark | $540,000 | |
| Previous Owner | Lacap Mark | $464,000 | |
| Previous Owner | Lacap Mark | $404,000 | |
| Previous Owner | Lacap Mark | $319,500 | |
| Previous Owner | Lacap Mark | $267,900 | |
| Previous Owner | Garcia Manuel | $18,000 |
| Date | Event | Price | Change | Sq Ft Price |
|---|---|---|---|---|
| 01/13/2015 01/13/15 | Sold | $476,000 | -1.7% | $287 / Sq Ft |
| 11/15/2014 11/15/14 | Pending | -- | -- | -- |
| 11/07/2014 11/07/14 | Price Changed | $484,000 | -1.0% | $292 / Sq Ft |
| 09/25/2014 09/25/14 | For Sale | $489,000 | +28.7% | $295 / Sq Ft |
| 09/27/2012 09/27/12 | Sold | $379,900 | 0.0% | $229 / Sq Ft |
| 08/15/2012 08/15/12 | Pending | -- | -- | -- |
| 07/26/2012 07/26/12 | Price Changed | $379,900 | -1.3% | $229 / Sq Ft |
| 07/11/2012 07/11/12 | Price Changed | $384,900 | -1.3% | $232 / Sq Ft |
| 06/28/2012 06/28/12 | Price Changed | $389,900 | -2.5% | $235 / Sq Ft |
| 06/22/2012 06/22/12 | For Sale | $399,888 | +5.3% | $241 / Sq Ft |
| 06/21/2012 06/21/12 | Off Market | $379,900 | -- | -- |
| 06/16/2012 06/16/12 | Price Changed | $399,888 | 0.0% | $241 / Sq Ft |
| 06/08/2012 06/08/12 | For Sale | $399,900 | +42.8% | $241 / Sq Ft |
| 05/15/2012 05/15/12 | Sold | $280,099 | -2.4% | $169 / Sq Ft |
| 02/23/2012 02/23/12 | Pending | -- | -- | -- |
| 02/22/2012 02/22/12 | Price Changed | $287,000 | 0.0% | $173 / Sq Ft |
| 02/22/2012 02/22/12 | For Sale | $287,000 | -3.4% | $173 / Sq Ft |
| 01/12/2012 01/12/12 | Pending | -- | -- | -- |
| 01/11/2012 01/11/12 | Price Changed | $297,000 | 0.0% | $179 / Sq Ft |
| 01/11/2012 01/11/12 | For Sale | $297,000 | -3.3% | $179 / Sq Ft |
| 12/13/2011 12/13/11 | Pending | -- | -- | -- |
| 12/09/2011 12/09/11 | For Sale | $307,000 | 0.0% | $185 / Sq Ft |
| 12/05/2011 12/05/11 | Price Changed | $307,000 | -3.2% | $185 / Sq Ft |
| 11/12/2011 11/12/11 | Pending | -- | -- | -- |
| 11/09/2011 11/09/11 | Price Changed | $317,000 | -3.1% | $191 / Sq Ft |
| 10/12/2011 10/12/11 | For Sale | $327,000 | 0.0% | $197 / Sq Ft |
| 10/01/2011 10/01/11 | Pending | -- | -- | -- |
| 09/22/2011 09/22/11 | Price Changed | $327,000 | -3.0% | $197 / Sq Ft |
| 08/23/2011 08/23/11 | Price Changed | $337,000 | +0.6% | $203 / Sq Ft |
| 08/12/2011 08/12/11 | For Sale | $335,000 | -- | $202 / Sq Ft |
| Year | Tax Paid | Tax Assessment Tax Assessment Total Assessment is a certain percentage of the fair market value that is determined by local assessors to be the total taxable value of land and additions on the property. | Land | Improvement |
|---|---|---|---|---|
| 2025 | $6,141 | $572,081 | $200,229 | $371,852 |
| 2024 | $6,141 | $560,864 | $196,303 | $364,561 |
| 2023 | $5,970 | $549,867 | $192,454 | $357,413 |
| 2022 | $5,933 | $539,085 | $188,680 | $350,405 |
| 2021 | $5,816 | $528,514 | $184,980 | $343,534 |
| 2020 | $5,740 | $523,094 | $183,083 | $340,011 |
| 2019 | $5,639 | $512,837 | $179,493 | $333,344 |
| 2018 | $5,513 | $502,782 | $175,974 | $326,808 |
| 2017 | $5,414 | $492,924 | $172,524 | $320,400 |
| 2016 | $5,058 | $483,259 | $169,141 | $314,118 |
| 2015 | $4,120 | $389,250 | $133,199 | $256,051 |
| 2014 | $4,038 | $381,625 | $130,590 | $251,035 |
Seller's Agent in 2015
Sally Ragan
T.N.G. Real Estate Consultants
(909) 938-7100
27 Total Sales
A
Buyer's Agent in 2015
Ann Hwu
American Global Asset Services
M
Seller's Agent in 2012
Marshall Parsons
NON-MEMBER/NBA or BTERM OFFICE
D
Seller's Agent in 2012
David Judd
Ojo Home California Inc.
Seller Co-Listing Agent in 2012
Josh Painter
Impact Real Estate
(951) 265-3524
47 Total Sales
Source: California Regional Multiple Listing Service (CRMLS)
MLS Number: PW14206512
APN: 1025-371-13
Disclaimer: Certain information contained herein is derived from information provided by parties other than Homes.com. All information provided is deemed reliable, but is not guaranteed to be accurate and should be independently verified.
![]() The multiple listing data appearing on this website, or contained in reports produced therefrom, is owned and copyrighted by California Regional Multiple Listing Service, Inc. ("CRMLS") and is protected by all applicable copyright laws. Information provided is for viewer's personal, non-commercial use and may not be used for any purpose other than to identify prospective properties the viewer may be interested in purchasing. All listing data, including but not limited to square footage and lot size is believed to be accurate, but the listing Agent, listing Broker and CRMLS and its affiliates do not warrant or guarantee such accuracy. The viewer should independently verify the listed data prior to making any decisions based on such information by personal inspection and/or contacting a real estate professional.
The multiple listing data appearing on this website, or contained in reports produced therefrom, is owned and copyrighted by California Regional Multiple Listing Service, Inc. ("CRMLS") and is protected by all applicable copyright laws. Information provided is for viewer's personal, non-commercial use and may not be used for any purpose other than to identify prospective properties the viewer may be interested in purchasing. All listing data, including but not limited to square footage and lot size is believed to be accurate, but the listing Agent, listing Broker and CRMLS and its affiliates do not warrant or guarantee such accuracy. The viewer should independently verify the listed data prior to making any decisions based on such information by personal inspection and/or contacting a real estate professional.
Based on information from California Regional Multiple Listing Service, Inc. and /or other sources. All data, including all measurements and calculations of area, is obtained from various sources and has not been, and will not be, verified by broker or MLS. All information should be independently reviewed and verified for accuracy. Properties may or may not be listed by the office/agent presenting the information