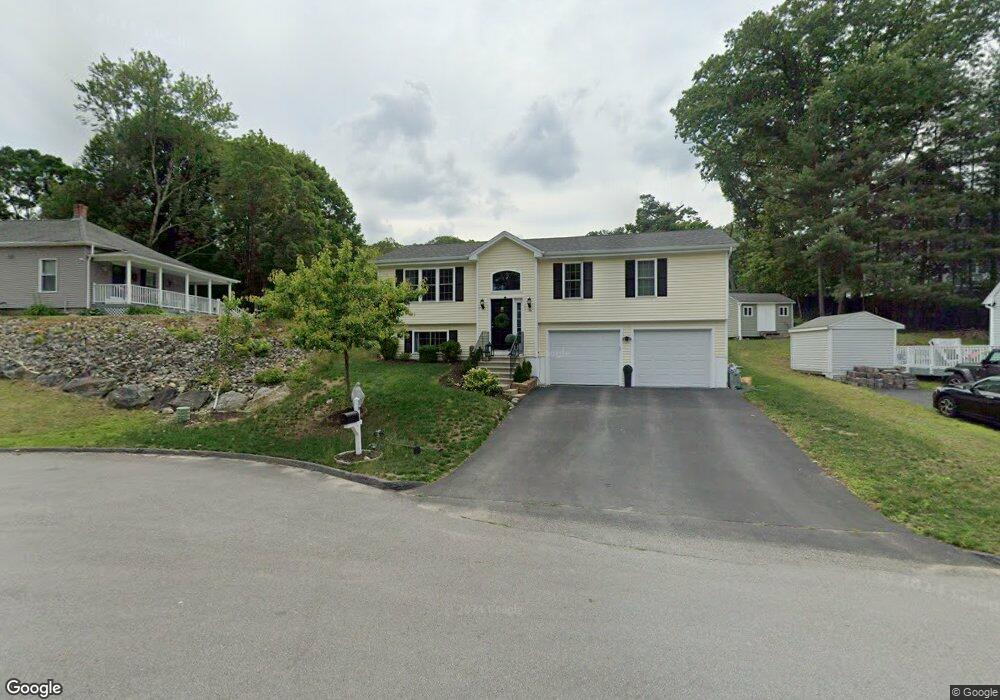
36A Quaboag St Worcester, MA 01602
Webster Square NeighborhoodEstimated Value: $459,000 - $497,677
3
Beds
2
Baths
1,106
Sq Ft
$433/Sq Ft
Est. Value
About This Home
This home is located at 36A Quaboag St, Worcester, MA 01602 and is currently estimated at $479,169, approximately $433 per square foot. 36A Quaboag St is a home with nearby schools including Chandler Magnet, Jacob Hiatt Magnet School, and May Street Elementary School.
Ownership History
Date
Name
Owned For
Owner Type
Purchase Details
Closed on
Feb 18, 2015
Sold by
Fox Hill Builders Inc
Bought by
Arboretum Estates Inc
Current Estimated Value
Purchase Details
Closed on
Jun 30, 2010
Sold by
Tivnan Daniel and Haghanizadeh Hossein
Bought by
Fox Hill Builders Inc
Purchase Details
Closed on
Feb 28, 2008
Sold by
Courtney-Mondor Marie P and Courtney-Mondor Marie
Bought by
Tivnan Daniel and Haghanizadeh Hossein
Create a Home Valuation Report for This Property
The Home Valuation Report is an in-depth analysis detailing your home's value as well as a comparison with similar homes in the area
Home Values in the Area
Average Home Value in this Area
Purchase History
| Date | Buyer | Sale Price | Title Company |
|---|---|---|---|
| Arboretum Estates Inc | -- | -- | |
| Fox Hill Builders Inc | $120,000 | -- | |
| Tivnan Daniel | $71,000 | -- |
Source: Public Records
Tax History Compared to Growth
Tax History
| Year | Tax Paid | Tax Assessment Tax Assessment Total Assessment is a certain percentage of the fair market value that is determined by local assessors to be the total taxable value of land and additions on the property. | Land | Improvement |
|---|---|---|---|---|
| 2025 | $6,214 | $471,100 | $98,600 | $372,500 |
| 2024 | $6,057 | $440,500 | $98,600 | $341,900 |
| 2023 | $5,951 | $415,000 | $85,800 | $329,200 |
| 2022 | $5,212 | $342,700 | $68,600 | $274,100 |
| 2021 | $5,055 | $310,500 | $54,900 | $255,600 |
| 2020 | $4,867 | $286,300 | $54,500 | $231,800 |
| 2019 | $4,927 | $273,700 | $47,700 | $226,000 |
| 2018 | $4,930 | $260,700 | $47,700 | $213,000 |
| 2017 | $4,694 | $244,200 | $47,700 | $196,500 |
| 2016 | $4,722 | $229,100 | $34,200 | $194,900 |
Source: Public Records
Map
Nearby Homes
- 5 Swan Ave
- 415 Mill St
- 41 Walnut Hill Dr
- 5 Amber St
- 71 Glendale St
- 45 Fourth St
- 45 Fourth St Unit Right
- 47 4th St
- 250 May St
- 57 1st St
- 47R Yarnie Unit 3B
- 47R Yarnie Unit 3A
- 47R Yarnie Unit 1B
- 47R Yarnie Unit 2B
- 47R Yarnie Unit 4B
- 47R Yarnie Unit 8B
- 47R Yarnie Unit 5A
- 47R Yarnie Unit 6B
- 47R Yarnie Unit 4A
- 47R Yarnie Unit 1A