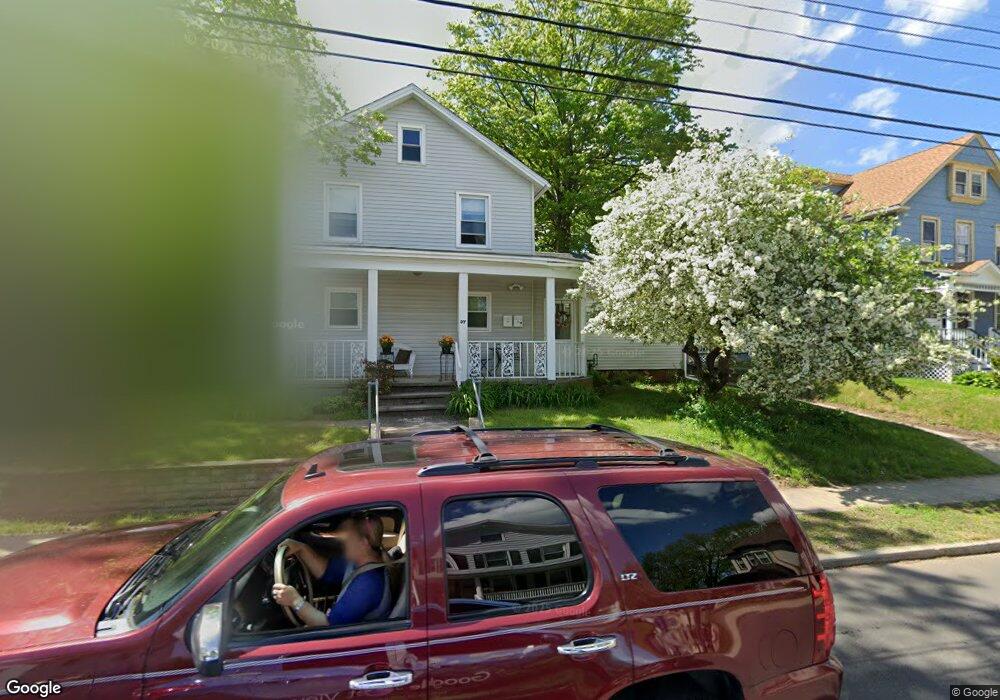
37-39 N Third Meriden, CT 06451
Estimated Value: $293,759 - $348,000
4
Beds
2
Baths
1,789
Sq Ft
$182/Sq Ft
Est. Value
About This Home
This home is located at 37-39 N Third, Meriden, CT 06451 and is currently estimated at $324,940, approximately $181 per square foot. 37-39 N Third is a home located in New Haven County with nearby schools including John Barry School, Lincoln Middle School, and Orville H. Platt High School.
Ownership History
Date
Name
Owned For
Owner Type
Purchase Details
Closed on
Jun 14, 2013
Sold by
Kwok Chun
Bought by
Zygmont Katherine L
Current Estimated Value
Home Financials for this Owner
Home Financials are based on the most recent Mortgage that was taken out on this home.
Original Mortgage
$140,389
Outstanding Balance
$96,153
Interest Rate
2.75%
Mortgage Type
FHA
Estimated Equity
$228,787
Purchase Details
Closed on
Dec 4, 2008
Sold by
Deutsche Bank Natl T C
Bought by
Kwok Chun
Purchase Details
Closed on
Sep 7, 2005
Sold by
Rahman Mujib U
Bought by
Javed Jemina E
Home Financials for this Owner
Home Financials are based on the most recent Mortgage that was taken out on this home.
Original Mortgage
$109,600
Interest Rate
6.54%
Purchase Details
Closed on
Nov 18, 2004
Sold by
Rossi Joseph J
Bought by
Rahamn Mujib U
Create a Home Valuation Report for This Property
The Home Valuation Report is an in-depth analysis detailing your home's value as well as a comparison with similar homes in the area
Home Values in the Area
Average Home Value in this Area
Purchase History
| Date | Buyer | Sale Price | Title Company |
|---|---|---|---|
| Zygmont Katherine L | $143,000 | -- | |
| Kwok Chun | $48,000 | -- | |
| Javed Jemina E | $137,000 | -- | |
| Rahamn Mujib U | $92,130 | -- |
Source: Public Records
Mortgage History
| Date | Status | Borrower | Loan Amount |
|---|---|---|---|
| Open | Rahamn Mujib U | $140,389 | |
| Closed | Rahamn Mujib U | $11,700 | |
| Previous Owner | Rahamn Mujib U | $109,600 |
Source: Public Records
Tax History
| Year | Tax Paid | Tax Assessment Tax Assessment Total Assessment is a certain percentage of the fair market value that is determined by local assessors to be the total taxable value of land and additions on the property. | Land | Improvement |
|---|---|---|---|---|
| 2025 | $4,519 | $119,210 | $38,360 | $80,850 |
| 2024 | $4,591 | $119,210 | $38,360 | $80,850 |
| 2023 | $4,425 | $119,210 | $38,360 | $80,850 |
| 2022 | $4,175 | $119,210 | $38,360 | $80,850 |
| 2021 | $3,757 | $86,310 | $32,830 | $53,480 |
| 2020 | $3,747 | $86,310 | $32,830 | $53,480 |
| 2019 | $3,715 | $86,310 | $32,830 | $53,480 |
| 2018 | $3,729 | $86,310 | $32,830 | $53,480 |
| 2017 | $3,630 | $86,310 | $32,830 | $53,480 |
| 2016 | $3,319 | $85,610 | $31,150 | $54,460 |
| 2015 | $3,319 | $85,610 | $31,150 | $54,460 |
| 2014 | $3,239 | $85,610 | $31,150 | $54,460 |
Source: Public Records
Map
Nearby Homes
Your Personal Tour Guide
Ask me questions while you tour the home.