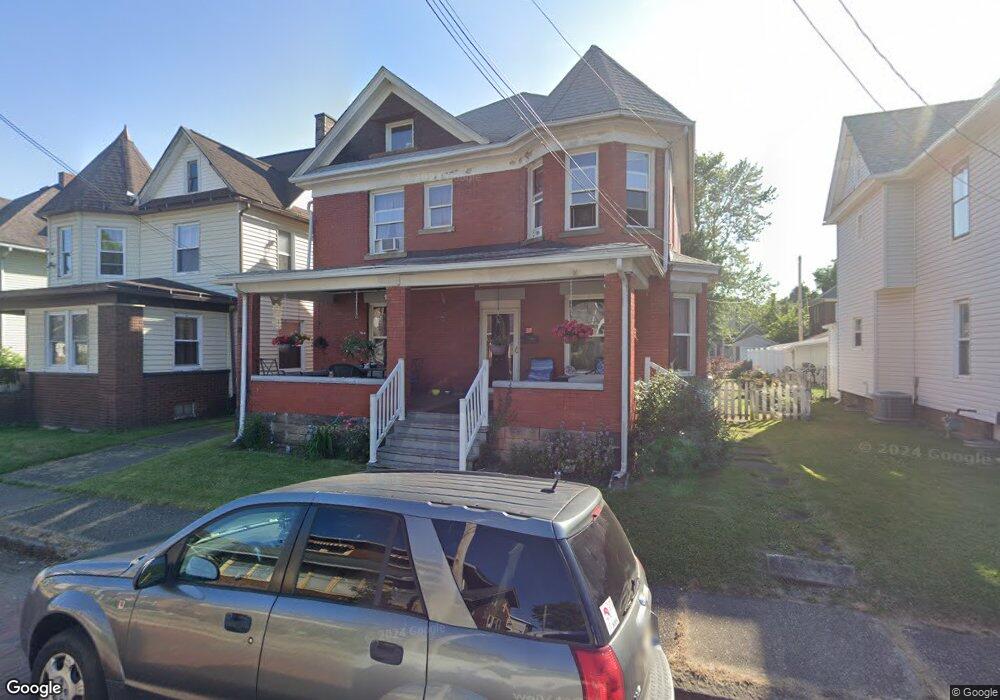
37 7th St SW Massillon, OH 44647
West Massillon NeighborhoodEstimated Value: $117,000 - $142,000
4
Beds
1
Bath
1,800
Sq Ft
$71/Sq Ft
Est. Value
About This Home
This home is located at 37 7th St SW, Massillon, OH 44647 and is currently estimated at $128,402, approximately $71 per square foot. 37 7th St SW is a home located in Stark County with nearby schools including Massillon Intermediate School, Massillon Junior High School, and Washington High School.
Ownership History
Date
Name
Owned For
Owner Type
Purchase Details
Closed on
Jan 13, 2010
Sold by
Equity Trust Company
Bought by
Able Property Management Llc
Current Estimated Value
Purchase Details
Closed on
Dec 30, 2009
Sold by
Fannie Mae
Bought by
Equity Trust Company and Mark Macrides Acct #91434 Ira
Purchase Details
Closed on
Nov 4, 2009
Sold by
Snair Adam
Bought by
Federal National Mortgage Association
Purchase Details
Closed on
Mar 30, 2007
Sold by
Beck Realty Inc
Bought by
Snair Adam
Home Financials for this Owner
Home Financials are based on the most recent Mortgage that was taken out on this home.
Original Mortgage
$76,000
Interest Rate
6.31%
Mortgage Type
Purchase Money Mortgage
Purchase Details
Closed on
Oct 23, 2006
Sold by
Us Bank Na
Bought by
Beck Realty Inc
Purchase Details
Closed on
May 31, 2006
Sold by
Roehlig Sally D and Roehlig Carl A
Bought by
U S Bank Na and Ameriquest Mortgage Securities Inc Float
Create a Home Valuation Report for This Property
The Home Valuation Report is an in-depth analysis detailing your home's value as well as a comparison with similar homes in the area
Home Values in the Area
Average Home Value in this Area
Purchase History
| Date | Buyer | Sale Price | Title Company |
|---|---|---|---|
| Able Property Management Llc | $24,000 | Attorney | |
| Equity Trust Company | $23,700 | Accutitle Agency Inc | |
| Federal National Mortgage Association | $48,000 | None Available | |
| Snair Adam | $76,000 | Accurate Title | |
| Beck Realty Inc | $19,000 | None Available | |
| U S Bank Na | $46,000 | None Available |
Source: Public Records
Mortgage History
| Date | Status | Borrower | Loan Amount |
|---|---|---|---|
| Previous Owner | Snair Adam | $76,000 |
Source: Public Records
Tax History
| Year | Tax Paid | Tax Assessment Tax Assessment Total Assessment is a certain percentage of the fair market value that is determined by local assessors to be the total taxable value of land and additions on the property. | Land | Improvement |
|---|---|---|---|---|
| 2025 | -- | $38,580 | $7,110 | $31,470 |
| 2024 | -- | $38,580 | $7,110 | $31,470 |
| 2023 | $1,605 | $30,560 | $5,710 | $24,850 |
| 2022 | $1,609 | $30,560 | $5,710 | $24,850 |
| 2021 | $1,635 | $30,560 | $5,710 | $24,850 |
| 2020 | $1,487 | $26,150 | $4,660 | $21,490 |
| 2019 | $1,467 | $26,160 | $4,660 | $21,500 |
Source: Public Records
Map
Nearby Homes
- 508 Tremont Ave SW
- 1105 Tremont Ave SW
- 431 5th St SW
- 104 12th St NW
- 514 4th St SW
- 1307 Main Ave W
- 1301 Lincoln Way NW
- 827 9th St SW
- 831 9th St SW
- 817 7th St SW
- 43 14th St NW
- 1521 Tremont Ave SW
- 907 Duncan St SW
- 864 Liberty Ct SW
- 804 15th St SW
- 533 Webb Ave SW
- 3447 Marys Way Ave NW
- 3488 Joyce Ave NW
- 918 15th St SW
- 1244 Patriot Place SW
Your Personal Tour Guide
Ask me questions while you tour the home.