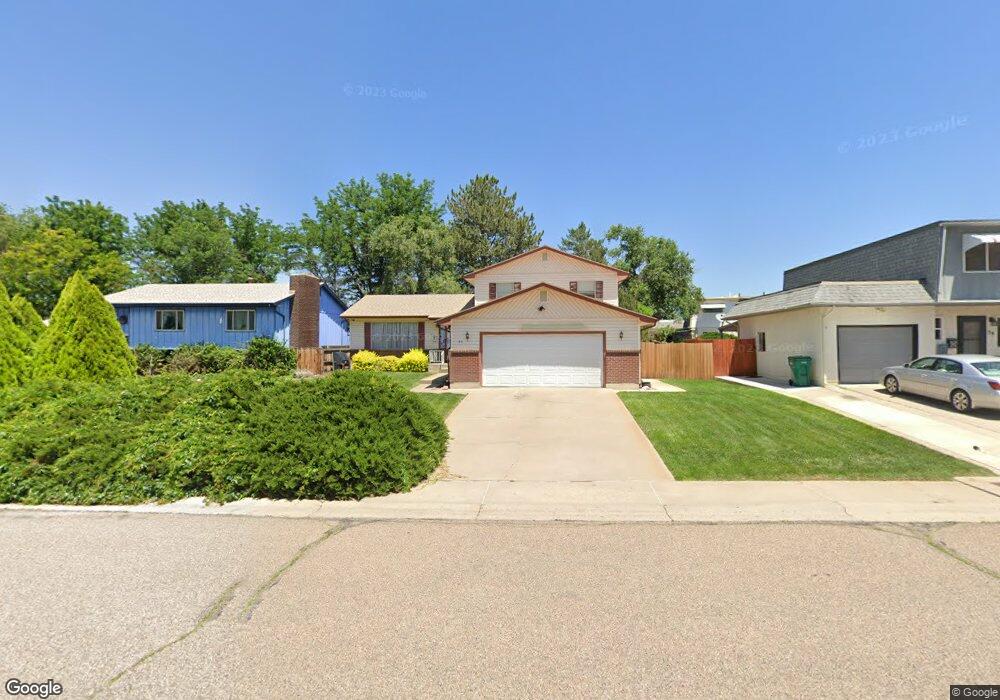
37 Apollo Ln Pueblo, CO 81001
Belmont NeighborhoodEstimated Value: $320,913 - $393,000
4
Beds
3
Baths
1,961
Sq Ft
$184/Sq Ft
Est. Value
About This Home
This home is located at 37 Apollo Ln, Pueblo, CO 81001 and is currently estimated at $360,978, approximately $184 per square foot. 37 Apollo Ln is a home located in Pueblo County with nearby schools including Belmont Elementary School, Heaton Middle School, and East High School.
Ownership History
Date
Name
Owned For
Owner Type
Purchase Details
Closed on
Aug 16, 2012
Sold by
Schiffner Six Inc
Bought by
Mcgriff Donald A
Current Estimated Value
Home Financials for this Owner
Home Financials are based on the most recent Mortgage that was taken out on this home.
Original Mortgage
$143,560
Outstanding Balance
$99,264
Interest Rate
3.63%
Mortgage Type
New Conventional
Estimated Equity
$261,714
Purchase Details
Closed on
Mar 23, 2007
Sold by
Schiffner Hildur E
Bought by
Schiffner Six Inc
Purchase Details
Closed on
Apr 30, 1999
Sold by
Mckinney Verona M and Mckinney Gross M
Bought by
Schiffner Hildur E Trust
Purchase Details
Closed on
Feb 25, 1988
Sold by
Boyd Charles L + Lieselotte
Bought by
Mckinney Verona M and Mckinney Gross M
Purchase Details
Closed on
Nov 5, 1976
Sold by
Edmonds L G + Aurel L
Bought by
Boyd Charles L + Lieselotte
Purchase Details
Closed on
Mar 12, 1976
Sold by
Lenhart John J + Judith
Bought by
Edmonds L G + Aurel L
Create a Home Valuation Report for This Property
The Home Valuation Report is an in-depth analysis detailing your home's value as well as a comparison with similar homes in the area
Home Values in the Area
Average Home Value in this Area
Purchase History
| Date | Buyer | Sale Price | Title Company |
|---|---|---|---|
| Mcgriff Donald A | $148,000 | Fidelity National Title Insu | |
| Schiffner Six Inc | -- | None Available | |
| Schiffner Hildur E Trust | $127,000 | -- | |
| Mckinney Verona M | $72,900 | -- | |
| Boyd Charles L + Lieselotte | $45,000 | -- | |
| Edmonds L G + Aurel L | $41,500 | -- |
Source: Public Records
Mortgage History
| Date | Status | Borrower | Loan Amount |
|---|---|---|---|
| Open | Mcgriff Donald A | $143,560 |
Source: Public Records
Tax History
| Year | Tax Paid | Tax Assessment Tax Assessment Total Assessment is a certain percentage of the fair market value that is determined by local assessors to be the total taxable value of land and additions on the property. | Land | Improvement |
|---|---|---|---|---|
| 2024 | $1,712 | $17,470 | -- | -- |
| 2023 | $1,731 | $21,160 | $1,340 | $19,820 |
| 2022 | $1,594 | $16,060 | $1,390 | $14,670 |
| 2021 | $1,645 | $16,520 | $1,430 | $15,090 |
| 2020 | $1,418 | $16,520 | $1,430 | $15,090 |
| 2019 | $1,419 | $14,050 | $1,073 | $12,977 |
| 2018 | $1,035 | $11,421 | $1,080 | $10,341 |
| 2017 | $1,045 | $11,421 | $1,080 | $10,341 |
| 2016 | $994 | $10,941 | $1,194 | $9,747 |
| 2015 | $990 | $10,941 | $1,194 | $9,747 |
| 2014 | $984 | $10,853 | $1,194 | $9,659 |
Source: Public Records
Map
Nearby Homes
- 55 Bonnymede Rd Unit S
- 21 Glenmore Rd
- 136 Douglas Ln
- 146 Douglas Ln
- 30 Bellita Dr
- 12 Cuesta Place
- 130 Scotland Rd Unit D
- 1915 Mohawk Rd
- 1925 Mohawk Rd
- 1901 Mohawk Rd
- 32 Scotland Rd
- 124 Scotland Rd Unit E
- 7 Baybridge Ct
- 1914 Cuchara Dr
- 1918 Cuchara Dr
- 106 Scotland Rd Unit E
- 1731 Jerry Murphy Rd
- 1732 Comanche Rd
- TBD Village Cir
- 7 Kingsbridge Place
- 39 Apollo Ln
- 35 Apollo Ln
- 41 Apollo Ln Unit 2
- 0 Apollo Ln
- 46 Bonnymede Rd Unit 50
- 46 Bonnymede Rd
- 43 Apollo Ln
- 52 Bonnymede Rd Unit 10
- 42 Bonnymede Rd Unit 44
- 33 Apollo Ln
- 54 Bonnymede Rd
- 45 Apollo Ln
- 56 Bonnymede Rd
- 36 Apollo Ln
- 58 Bonnymede Rd
- 58 Bonnymede Rd Unit 7
- 34 Apollo Ln
- 38 Bonnymede Rd Unit 40
- 38 Apollo Ln
- 0 Bonnymede Rd
Your Personal Tour Guide
Ask me questions while you tour the home.