Estimated Value: $348,000 - $371,000
3
Beds
2
Baths
1,728
Sq Ft
$207/Sq Ft
Est. Value
About This Home
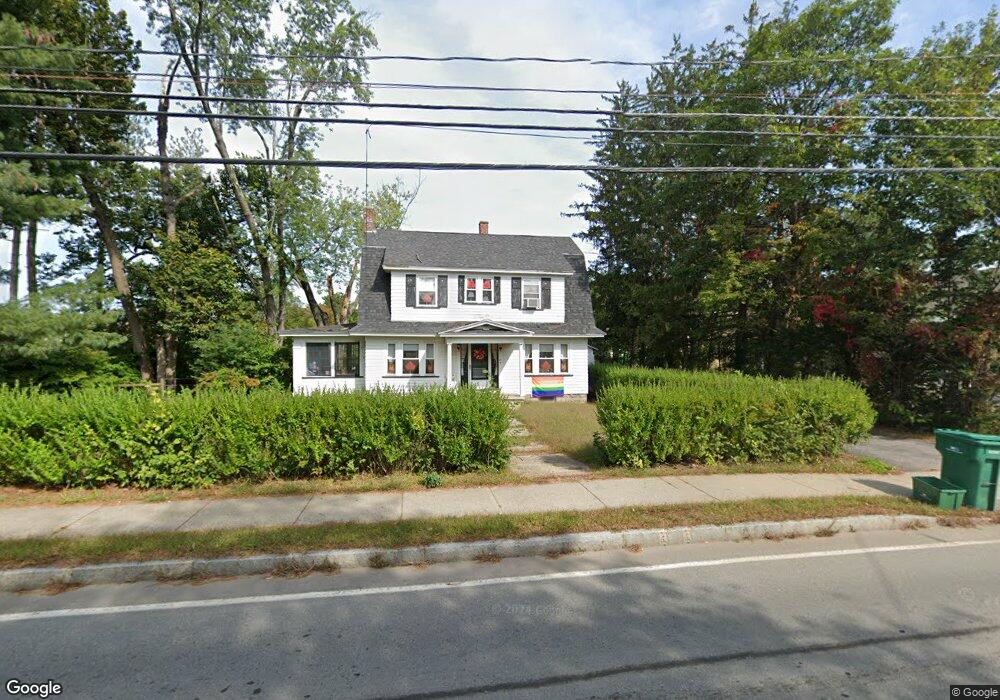
This home is located at 37 Arch St, Keene, NH 03431 and is currently estimated at $358,503, approximately $207 per square foot. 37 Arch St is a home located in Cheshire County with nearby schools including Keene Middle School, Keene High School, and Gathering Waters Charter School (H).
Ownership History
Date
Name
Owned For
Owner Type
Purchase Details
Closed on
Sep 29, 2010
Sold by
Cobb Lee J and Cobb Elizabeth A
Bought by
Fessenden Bret Alan and Benner-Fessenden Cynthia
Current Estimated Value
Home Financials for this Owner
Home Financials are based on the most recent Mortgage that was taken out on this home.
Original Mortgage
$163,794
Outstanding Balance
$109,562
Interest Rate
4.62%
Mortgage Type
FHA
Estimated Equity
$248,941
Purchase Details
Closed on
Aug 5, 2009
Sold by
Seymour Thomas W and Seymour Kathryn L
Bought by
Beneficial Mortgage Co
Create a Home Valuation Report for This Property
The Home Valuation Report is an in-depth analysis detailing your home's value as well as a comparison with similar homes in the area
Home Values in the Area
Average Home Value in this Area
Purchase History
| Date | Buyer | Sale Price | Title Company |
|---|---|---|---|
| Fessenden Bret Alan | $166,000 | -- | |
| Beneficial Mortgage Co | $161,600 | -- |
Source: Public Records
Mortgage History
| Date | Status | Borrower | Loan Amount |
|---|---|---|---|
| Open | Beneficial Mortgage Co | $163,794 |
Source: Public Records
Tax History Compared to Growth
Tax History
| Year | Tax Paid | Tax Assessment Tax Assessment Total Assessment is a certain percentage of the fair market value that is determined by local assessors to be the total taxable value of land and additions on the property. | Land | Improvement |
|---|---|---|---|---|
| 2024 | $6,439 | $194,700 | $52,200 | $142,500 |
| 2023 | $6,209 | $194,700 | $52,200 | $142,500 |
| 2022 | $6,042 | $194,700 | $52,200 | $142,500 |
| 2021 | $6,090 | $194,700 | $52,200 | $142,500 |
| 2020 | $6,058 | $162,500 | $61,000 | $101,500 |
| 2019 | $6,110 | $162,500 | $61,000 | $101,500 |
| 2018 | $6,032 | $162,500 | $61,000 | $101,500 |
| 2017 | $6,045 | $162,400 | $60,900 | $101,500 |
| 2016 | $5,910 | $162,400 | $60,900 | $101,500 |
| 2015 | $5,874 | $170,700 | $64,700 | $106,000 |
Source: Public Records
Map
Nearby Homes
- 257 Park Ave
- 89 Kendall Rd
- 7 Newman St
- 110 Arch St Unit 27
- 110 Arch St Unit 42
- 30 Nelson St
- 23 Base Hill Rd
- 220 Hurricane Rd
- 28 Stonehouse Ln
- 32a Stonehouse Ln
- 38 Stonehouse Ln Unit A
- 168 Arch St
- 11 Nut Hatch Ln
- 67 Woodburn St
- 106 Pako Ave
- 0 Stevens St Unit 1
- 66 Forest St
- 29 Windsor Ct Unit K
- 23 Schult St
- 39 Windsor Ct Unit B