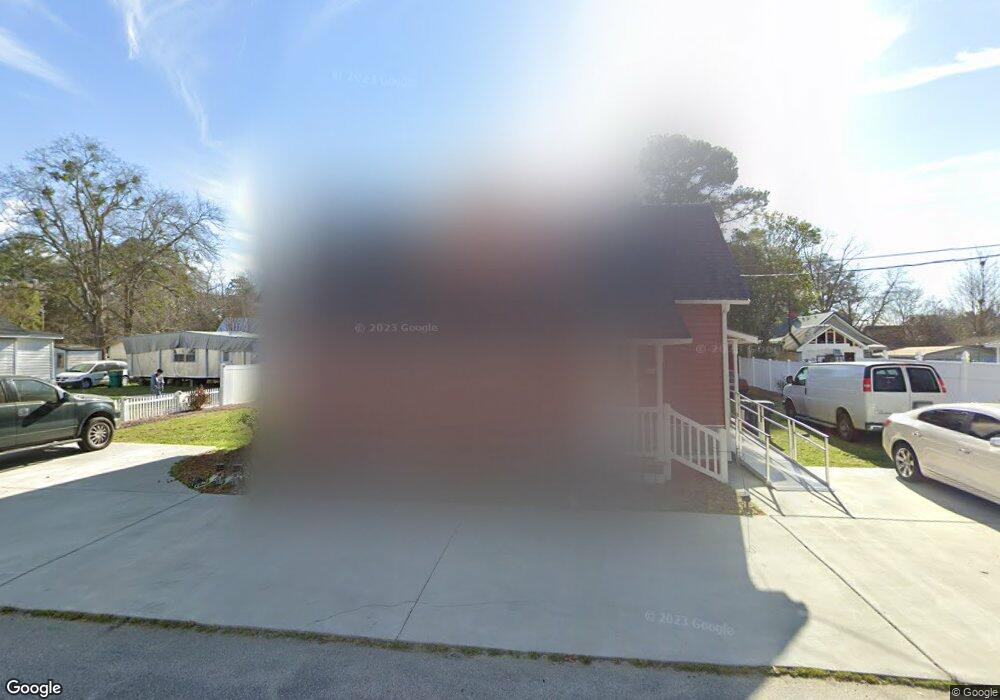
37 Bradford St Lumberton, NC 28358
Estimated Value: $73,000 - $163,000
3
Beds
2
Baths
1,575
Sq Ft
$80/Sq Ft
Est. Value
About This Home
This home is located at 37 Bradford St, Lumberton, NC 28358 and is currently estimated at $126,652, approximately $80 per square foot. 37 Bradford St is a home located in Robeson County with nearby schools including Tanglewood Elementary School, Parkton Elementary School, and L. Gilbert Carroll Middle School.
Ownership History
Date
Name
Owned For
Owner Type
Purchase Details
Closed on
Mar 2, 2023
Sold by
Martin Crystal
Bought by
Thompson Johnny Lee Allen
Current Estimated Value
Purchase Details
Closed on
Mar 5, 2020
Sold by
Thompson Jeffery T and Thompson Jeffrey T
Bought by
Thompson Johnny Lee Allen and Martin Crystal
Purchase Details
Closed on
Jun 13, 2017
Sold by
Watts Kimberly and Watts Ivan
Bought by
Thompson Jeffery T
Purchase Details
Closed on
Aug 23, 2007
Sold by
Watts Kimberly and Pittman Kimberly S
Bought by
Watts Kimberly and Watts Ivan
Create a Home Valuation Report for This Property
The Home Valuation Report is an in-depth analysis detailing your home's value as well as a comparison with similar homes in the area
Home Values in the Area
Average Home Value in this Area
Purchase History
| Date | Buyer | Sale Price | Title Company |
|---|---|---|---|
| Thompson Johnny Lee Allen | -- | -- | |
| Thompson Johnny Lee Allen | -- | None Available | |
| Thompson Jeffery T | $5,000 | None Available | |
| Watts Kimberly | -- | -- |
Source: Public Records
Tax History Compared to Growth
Tax History
| Year | Tax Paid | Tax Assessment Tax Assessment Total Assessment is a certain percentage of the fair market value that is determined by local assessors to be the total taxable value of land and additions on the property. | Land | Improvement |
|---|---|---|---|---|
| 2025 | $721 | $85,400 | $5,500 | $79,900 |
| 2024 | $716 | $85,400 | $5,500 | $79,900 |
| 2023 | $433 | $47,600 | $5,000 | $42,600 |
| 2022 | $433 | $47,600 | $5,000 | $42,600 |
| 2021 | $433 | $47,600 | $5,000 | $42,600 |
| 2020 | $418 | $47,600 | $5,000 | $42,600 |
| 2018 | $427 | $34,500 | $5,000 | $29,500 |
| 2017 | $326 | $34,500 | $5,000 | $29,500 |
| 2016 | $326 | $34,500 | $5,000 | $29,500 |
| 2015 | $326 | $34,500 | $5,000 | $29,500 |
| 2014 | $326 | $34,500 | $5,000 | $29,500 |
Source: Public Records
Map
Nearby Homes