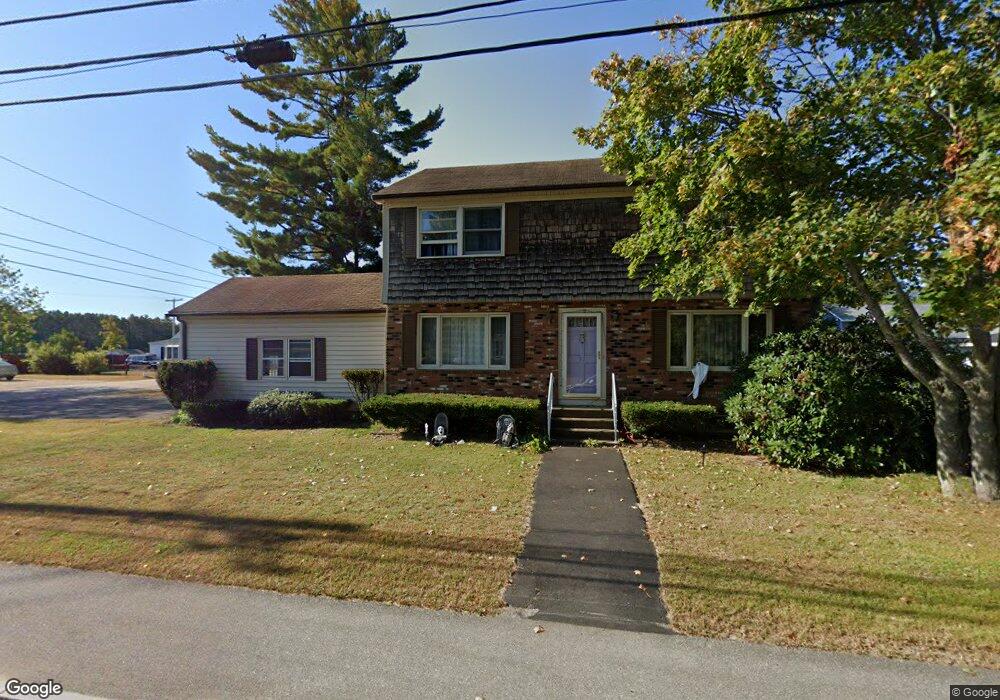
37 Brock St Rochester, NH 03867
Estimated Value: $390,000 - $455,000
4
Beds
2
Baths
1,768
Sq Ft
$241/Sq Ft
Est. Value
About This Home
This home is located at 37 Brock St, Rochester, NH 03867 and is currently estimated at $425,609, approximately $240 per square foot. 37 Brock St is a home located in Strafford County with nearby schools including Mcclelland School, Rochester Middle School, and Spaulding High School.
Ownership History
Date
Name
Owned For
Owner Type
Purchase Details
Closed on
Sep 2, 2025
Sold by
Hynes David M and Hynes Donna M
Bought by
Sicari Rachel A
Current Estimated Value
Home Financials for this Owner
Home Financials are based on the most recent Mortgage that was taken out on this home.
Original Mortgage
$323,500
Outstanding Balance
$323,221
Interest Rate
6.74%
Mortgage Type
New Conventional
Estimated Equity
$102,388
Purchase Details
Closed on
Apr 2, 2018
Sold by
Hynes David M and Hynes Donna M
Bought by
Sicari Rachel A and Hynes Donna M
Purchase Details
Closed on
Oct 21, 1992
Bought by
Hynes David M and Hynes Donna M
Create a Home Valuation Report for This Property
The Home Valuation Report is an in-depth analysis detailing your home's value as well as a comparison with similar homes in the area
Home Values in the Area
Average Home Value in this Area
Purchase History
| Date | Buyer | Sale Price | Title Company |
|---|---|---|---|
| Sicari Rachel A | $210,000 | -- | |
| Sicari Rachel A | $210,000 | -- | |
| Sicari Rachel A | -- | -- | |
| Sicari Rachel A | -- | -- | |
| Hynes David M | $75,000 | -- |
Source: Public Records
Mortgage History
| Date | Status | Borrower | Loan Amount |
|---|---|---|---|
| Open | Sicari Rachel A | $323,500 | |
| Closed | Sicari Rachel A | $323,500 |
Source: Public Records
Tax History Compared to Growth
Tax History
| Year | Tax Paid | Tax Assessment Tax Assessment Total Assessment is a certain percentage of the fair market value that is determined by local assessors to be the total taxable value of land and additions on the property. | Land | Improvement |
|---|---|---|---|---|
| 2024 | $5,333 | $359,100 | $87,600 | $271,500 |
| 2023 | $5,472 | $212,600 | $53,100 | $159,500 |
| 2022 | $5,375 | $212,600 | $53,100 | $159,500 |
| 2021 | $5,241 | $212,600 | $53,100 | $159,500 |
| 2020 | $5,235 | $212,700 | $53,100 | $159,600 |
| 2019 | $4,955 | $199,000 | $53,100 | $145,900 |
| 2018 | $5,138 | $186,700 | $36,300 | $150,400 |
| 2017 | $4,916 | $186,700 | $36,300 | $150,400 |
| 2016 | $4,759 | $168,400 | $36,300 | $132,100 |
| 2015 | $4,740 | $168,400 | $36,300 | $132,100 |
| 2014 | $4,626 | $168,400 | $36,300 | $132,100 |
| 2013 | $4,508 | $171,000 | $48,500 | $122,500 |
| 2012 | $4,391 | $171,000 | $48,500 | $122,500 |
Source: Public Records
Map
Nearby Homes