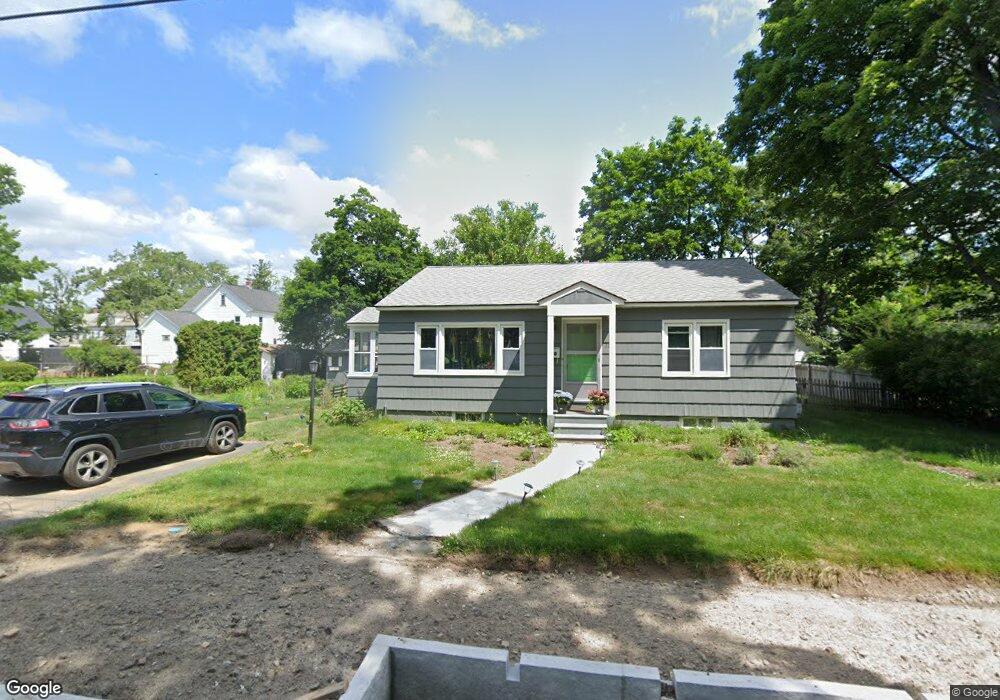
37 Cherry St Easthampton, MA 01027
Estimated Value: $330,000 - $372,000
2
Beds
2
Baths
954
Sq Ft
$367/Sq Ft
Est. Value
About This Home
This home is located at 37 Cherry St, Easthampton, MA 01027 and is currently estimated at $350,283, approximately $367 per square foot. 37 Cherry St is a home located in Hampshire County with nearby schools including Easthampton High School, Tri-County Schools, and New England Adolescent Research Institute.
Ownership History
Date
Name
Owned For
Owner Type
Purchase Details
Closed on
Jul 30, 2009
Sold by
Lorenz Steven J and Johnson Justine M
Bought by
Dube Matthew P and Flanders Melissa N
Current Estimated Value
Home Financials for this Owner
Home Financials are based on the most recent Mortgage that was taken out on this home.
Original Mortgage
$176,700
Outstanding Balance
$116,495
Interest Rate
5.43%
Mortgage Type
Purchase Money Mortgage
Estimated Equity
$233,788
Purchase Details
Closed on
Jul 17, 2001
Sold by
Lacroix Kevin M and Lacroix Martha S
Bought by
Johnson Justine M and Lorenz Steven J
Home Financials for this Owner
Home Financials are based on the most recent Mortgage that was taken out on this home.
Original Mortgage
$108,240
Interest Rate
7.2%
Mortgage Type
Purchase Money Mortgage
Purchase Details
Closed on
Oct 9, 1992
Sold by
Schumann Dora M
Bought by
Lacroix Martha S and Lacroix Kevin M
Home Financials for this Owner
Home Financials are based on the most recent Mortgage that was taken out on this home.
Original Mortgage
$85,556
Interest Rate
7.99%
Mortgage Type
Purchase Money Mortgage
Create a Home Valuation Report for This Property
The Home Valuation Report is an in-depth analysis detailing your home's value as well as a comparison with similar homes in the area
Home Values in the Area
Average Home Value in this Area
Purchase History
| Date | Buyer | Sale Price | Title Company |
|---|---|---|---|
| Dube Matthew P | $186,000 | -- | |
| Johnson Justine M | $123,000 | -- | |
| Lacroix Martha S | $87,500 | -- |
Source: Public Records
Mortgage History
| Date | Status | Borrower | Loan Amount |
|---|---|---|---|
| Open | Dube Matthew P | $176,700 | |
| Previous Owner | Lacroix Martha S | $108,240 | |
| Previous Owner | Lacroix Martha S | $85,556 |
Source: Public Records
Tax History
| Year | Tax Paid | Tax Assessment Tax Assessment Total Assessment is a certain percentage of the fair market value that is determined by local assessors to be the total taxable value of land and additions on the property. | Land | Improvement |
|---|---|---|---|---|
| 2025 | $3,717 | $271,900 | $105,700 | $166,200 |
| 2024 | $3,585 | $264,400 | $102,500 | $161,900 |
| 2023 | $2,732 | $186,500 | $80,900 | $105,600 |
| 2022 | $3,083 | $186,500 | $80,900 | $105,600 |
| 2021 | $3,368 | $192,000 | $80,900 | $111,100 |
| 2020 | $3,312 | $186,500 | $80,900 | $105,600 |
| 2019 | $2,893 | $187,100 | $80,900 | $106,200 |
| 2018 | $2,773 | $173,300 | $76,400 | $96,900 |
| 2017 | $2,704 | $166,800 | $73,400 | $93,400 |
| 2016 | $2,600 | $166,800 | $73,400 | $93,400 |
| 2015 | $2,527 | $166,800 | $73,400 | $93,400 |
Source: Public Records
Map
Nearby Homes
- 40 Clark St
- 2 Oak St
- 4 Gaugh St
- 33 Knipfer Ave
- 19 Nicols Way Unit 19
- 7 Union Ct
- 12 Glen Cove Place Unit B
- 10 Glen Cove Place Unit A
- 18-20 Oakdale Place
- 29 Parsons St Unit 1
- 6 Wilton Rd
- 11 Dragon Cir
- 6 S St & Abutting Lots
- 41 South St Unit 11
- 36 & 36R Holly Cir
- 2 W Park Dr
- 336 Main St
- 211 East St Unit 11
- 385 Main St
- M143 &152 Glendale St
Your Personal Tour Guide
Ask me questions while you tour the home.