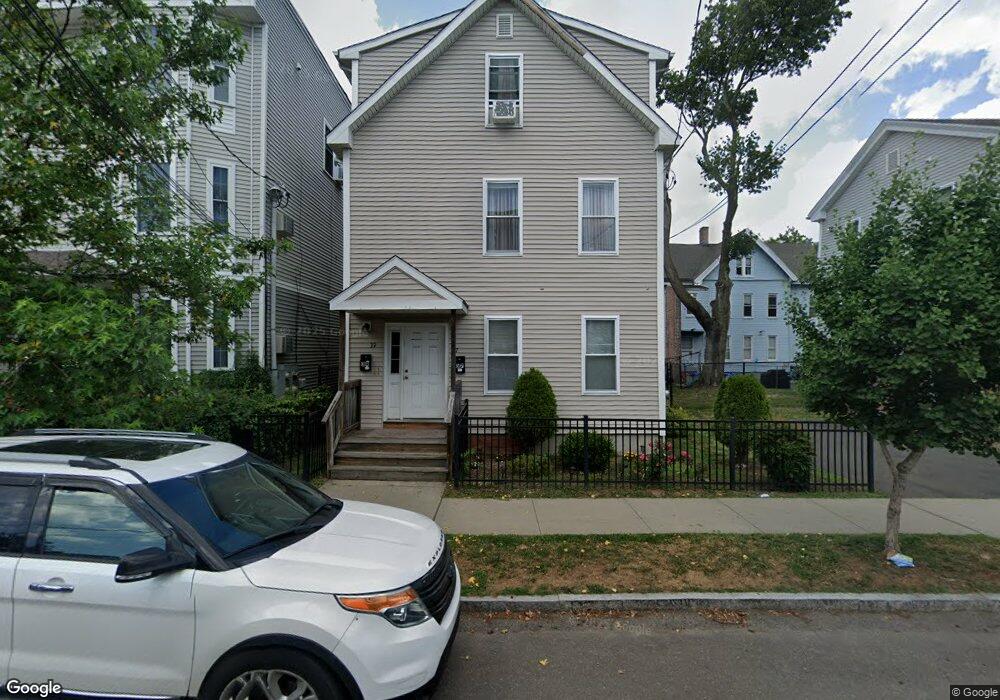
37 Clay St New Haven, CT 06513
Fair Haven NeighborhoodEstimated Value: $271,000 - $384,000
4
Beds
2
Baths
2,965
Sq Ft
$110/Sq Ft
Est. Value
About This Home
This home is located at 37 Clay St, New Haven, CT 06513 and is currently estimated at $326,465, approximately $110 per square foot. 37 Clay St is a home located in New Haven County with nearby schools including Clinton Avenue School, Elm City College Preparatory School, and Cold Spring School.
Ownership History
Date
Name
Owned For
Owner Type
Purchase Details
Closed on
Oct 31, 2001
Sold by
Ortiz Manuel and Ortiz Gladys
Bought by
Diaz Roberto
Current Estimated Value
Purchase Details
Closed on
Jun 7, 1999
Sold by
Baez Const Co Llc
Bought by
Ortiz Manuel and Ortiz Gladys
Purchase Details
Closed on
Jul 9, 1998
Sold by
Est Nazario Angelina and Sagnella Caroline
Bought by
Baez Const Co Llc
Create a Home Valuation Report for This Property
The Home Valuation Report is an in-depth analysis detailing your home's value as well as a comparison with similar homes in the area
Home Values in the Area
Average Home Value in this Area
Purchase History
| Date | Buyer | Sale Price | Title Company |
|---|---|---|---|
| Diaz Roberto | $120,000 | -- | |
| Ortiz Manuel | $79,000 | -- | |
| Baez Const Co Llc | $30,000 | -- |
Source: Public Records
Mortgage History
| Date | Status | Borrower | Loan Amount |
|---|---|---|---|
| Open | Baez Const Co Llc | $200,000 | |
| Closed | Baez Const Co Llc | $325,000 | |
| Open | Baez Const Co Llc | $600,000 |
Source: Public Records
Tax History
| Year | Tax Paid | Tax Assessment Tax Assessment Total Assessment is a certain percentage of the fair market value that is determined by local assessors to be the total taxable value of land and additions on the property. | Land | Improvement |
|---|---|---|---|---|
| 2025 | $4,137 | $105,000 | $27,860 | $77,140 |
| 2024 | $4,043 | $105,000 | $27,860 | $77,140 |
| 2023 | $6,815 | $183,190 | $27,860 | $155,330 |
| 2022 | $7,282 | $183,190 | $27,860 | $155,330 |
| 2021 | $3,609 | $82,258 | $22,330 | $59,928 |
| 2020 | $3,609 | $82,258 | $22,330 | $59,928 |
| 2019 | $3,535 | $82,258 | $22,330 | $59,928 |
| 2018 | $3,535 | $82,258 | $22,330 | $59,928 |
| 2017 | $4,023 | $104,020 | $22,330 | $81,690 |
| 2016 | $2,665 | $64,133 | $14,910 | $49,223 |
| 2015 | $2,665 | $64,133 | $14,910 | $49,223 |
| 2014 | $3,016 | $72,590 | $14,910 | $57,680 |
Source: Public Records
Map
Nearby Homes
Your Personal Tour Guide
Ask me questions while you tour the home.