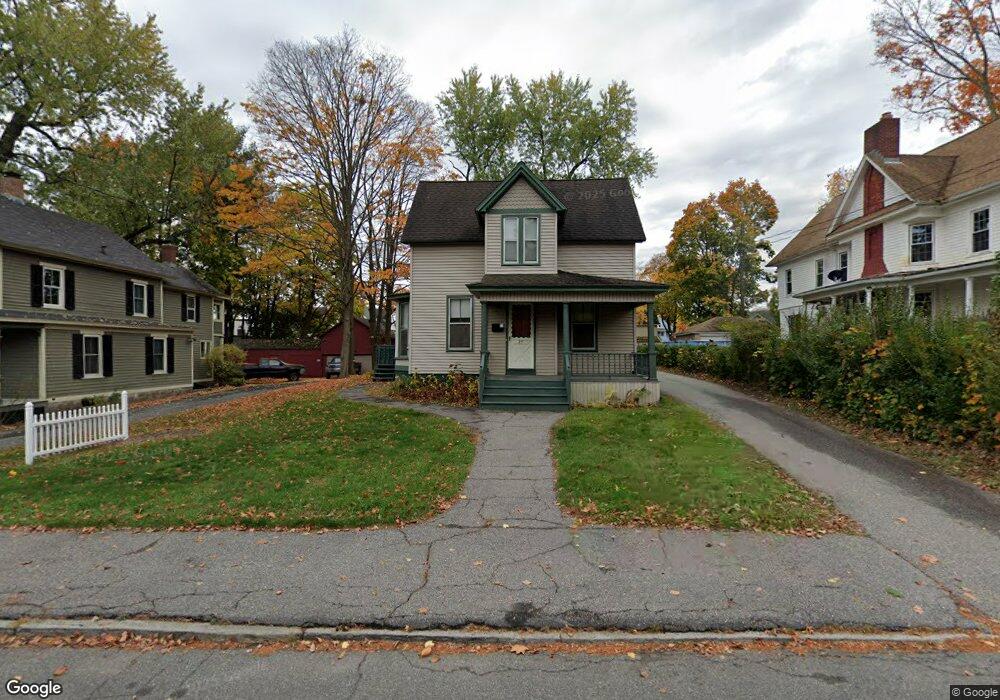
37 Cook St Torrington, CT 06790
Estimated Value: $263,000 - $281,000
2
Beds
2
Baths
1,672
Sq Ft
$164/Sq Ft
Est. Value
About This Home
This home is located at 37 Cook St, Torrington, CT 06790 and is currently estimated at $275,011, approximately $164 per square foot. 37 Cook St is a home located in Litchfield County with nearby schools including Torrington Middle School, Torrington High School, and Brooker Memorial CC & Learning Center.
Ownership History
Date
Name
Owned For
Owner Type
Purchase Details
Closed on
Oct 30, 2006
Sold by
Poirier Bruce J
Bought by
Hayes-Lovejoy Nancy A
Current Estimated Value
Home Financials for this Owner
Home Financials are based on the most recent Mortgage that was taken out on this home.
Original Mortgage
$155,000
Outstanding Balance
$93,069
Interest Rate
6.48%
Estimated Equity
$181,942
Purchase Details
Closed on
Sep 9, 1994
Sold by
Bht Ltd Lp
Bought by
Poirier Bruce J
Home Financials for this Owner
Home Financials are based on the most recent Mortgage that was taken out on this home.
Original Mortgage
$70,000
Interest Rate
7.88%
Mortgage Type
Unknown
Purchase Details
Closed on
Feb 19, 1988
Sold by
Trahan Charles E
Bought by
Yoder Norman A
Create a Home Valuation Report for This Property
The Home Valuation Report is an in-depth analysis detailing your home's value as well as a comparison with similar homes in the area
Home Values in the Area
Average Home Value in this Area
Purchase History
| Date | Buyer | Sale Price | Title Company |
|---|---|---|---|
| Hayes-Lovejoy Nancy A | $165,000 | -- | |
| Poirier Bruce J | $59,400 | -- | |
| Bht Ltd Lp | $59,200 | -- | |
| Yoder Norman A | $130,000 | -- |
Source: Public Records
Mortgage History
| Date | Status | Borrower | Loan Amount |
|---|---|---|---|
| Open | Yoder Norman A | $155,000 | |
| Previous Owner | Yoder Norman A | $136,000 | |
| Previous Owner | Yoder Norman A | $70,000 | |
| Previous Owner | Yoder Norman A | $108,000 |
Source: Public Records
Tax History Compared to Growth
Tax History
| Year | Tax Paid | Tax Assessment Tax Assessment Total Assessment is a certain percentage of the fair market value that is determined by local assessors to be the total taxable value of land and additions on the property. | Land | Improvement |
|---|---|---|---|---|
| 2025 | $6,075 | $157,990 | $20,370 | $137,620 |
| 2024 | $3,545 | $73,900 | $20,370 | $53,530 |
| 2023 | $3,544 | $73,900 | $20,370 | $53,530 |
| 2022 | $3,484 | $73,900 | $20,370 | $53,530 |
| 2021 | $3,412 | $73,900 | $20,370 | $53,530 |
| 2020 | $3,412 | $73,900 | $20,370 | $53,530 |
| 2019 | $3,504 | $75,900 | $20,370 | $55,530 |
| 2018 | $3,504 | $75,900 | $20,370 | $55,530 |
| 2017 | $3,472 | $75,900 | $20,370 | $55,530 |
| 2016 | $3,472 | $75,900 | $20,370 | $55,530 |
| 2015 | $3,472 | $75,900 | $20,370 | $55,530 |
| 2014 | $3,369 | $92,770 | $28,000 | $64,770 |
Source: Public Records
Map
Nearby Homes
- 271 S Main St
- 10 Irene St
- 77 Marion Ave Unit 2
- 393 S Main St
- 149 Turner Ave
- 184 Harwinton Ave
- 21 Roosevelt Ave
- 53 Harwinton Ave Unit 4
- 75 Maple St
- 00 Church St
- 30 Culvert St
- 231 Beechwood Ave
- 160 Laurel Hill Rd
- 121 Culvert St
- 21 Brookside Ave
- 25 George St
- 279 Main St
- 291 E Main St
- 118 Pearl St
- 173 Chestnut Ave