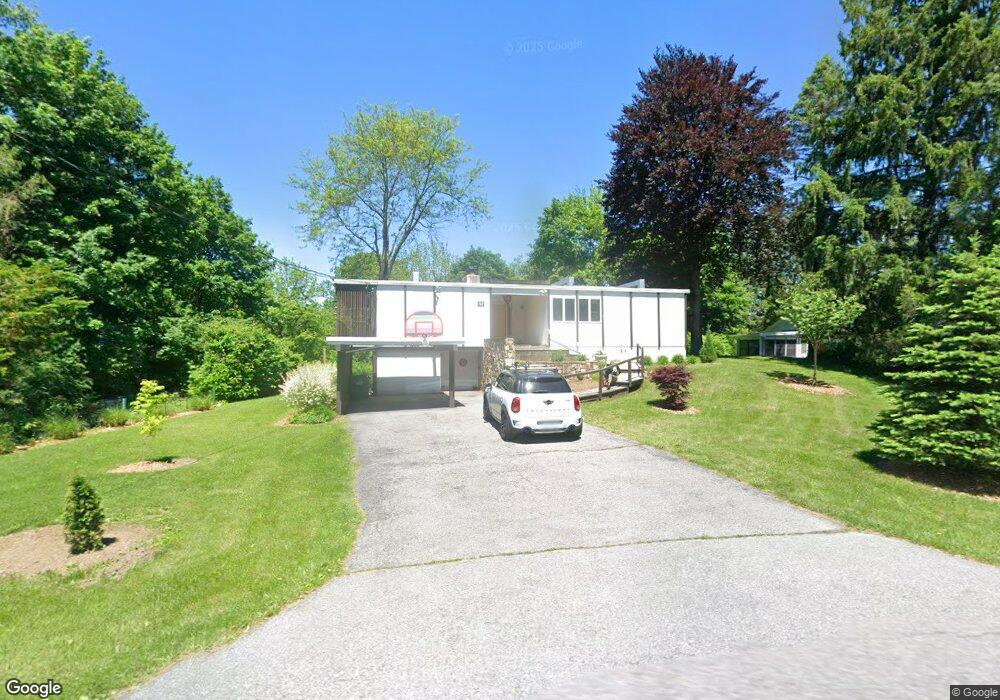
37 Croft Rd Poughkeepsie, NY 12603
Estimated Value: $446,000 - $477,000
4
Beds
3
Baths
1,713
Sq Ft
$268/Sq Ft
Est. Value
About This Home
This home is located at 37 Croft Rd, Poughkeepsie, NY 12603 and is currently estimated at $459,256, approximately $268 per square foot. 37 Croft Rd is a home located in Dutchess County with nearby schools including Spackenkill High School, Poughkeepsie Community Seventh-Day Adventist School, and Poughkeepsie Day School.
Ownership History
Date
Name
Owned For
Owner Type
Purchase Details
Closed on
Jul 29, 2019
Sold by
Francoisse M Liang Lt
Bought by
Taylor Joseph B and Taylor Wendy M
Current Estimated Value
Home Financials for this Owner
Home Financials are based on the most recent Mortgage that was taken out on this home.
Original Mortgage
$266,000
Outstanding Balance
$175,610
Interest Rate
3.73%
Mortgage Type
New Conventional
Estimated Equity
$283,646
Purchase Details
Closed on
Mar 20, 2007
Sold by
Liang Hsi-Huey
Bought by
Liang Francoise
Create a Home Valuation Report for This Property
The Home Valuation Report is an in-depth analysis detailing your home's value as well as a comparison with similar homes in the area
Home Values in the Area
Average Home Value in this Area
Purchase History
| Date | Buyer | Sale Price | Title Company |
|---|---|---|---|
| Taylor Joseph B | -- | -- | |
| Liang Francoise | -- | -- |
Source: Public Records
Mortgage History
| Date | Status | Borrower | Loan Amount |
|---|---|---|---|
| Open | Taylor Joseph B | $266,000 |
Source: Public Records
Tax History
| Year | Tax Paid | Tax Assessment Tax Assessment Total Assessment is a certain percentage of the fair market value that is determined by local assessors to be the total taxable value of land and additions on the property. | Land | Improvement |
|---|---|---|---|---|
| 2024 | $13,238 | $391,000 | $88,700 | $302,300 |
| 2023 | $27,496 | $391,000 | $88,700 | $302,300 |
| 2019 | $8,451 | $246,000 | $80,600 | $165,400 |
Source: Public Records
Map
Nearby Homes
- 220 Wilbur Blvd
- 42 Beechwood Park
- 16 Kingwood Ln
- 17 Santa Anna Dr
- 2710 South Rd Unit B5
- 2710 South Rd Unit A4
- 45 Old Farms Rd
- 174 Cedar Ave
- 75 Beechwood Ave
- 102 Cedar Ave
- 2740 South Rd Unit G11
- 90 Cedar Ave
- 14 Bellmore Dr
- 2343 South Rd
- 26 Antoinette Dr
- 1907 Magnolia Walk
- 2202 Mulberry Ct
- 1202 Fox Ln
- 908 Scenic Ln
- 50 Mitchell Ave
Your Personal Tour Guide
Ask me questions while you tour the home.