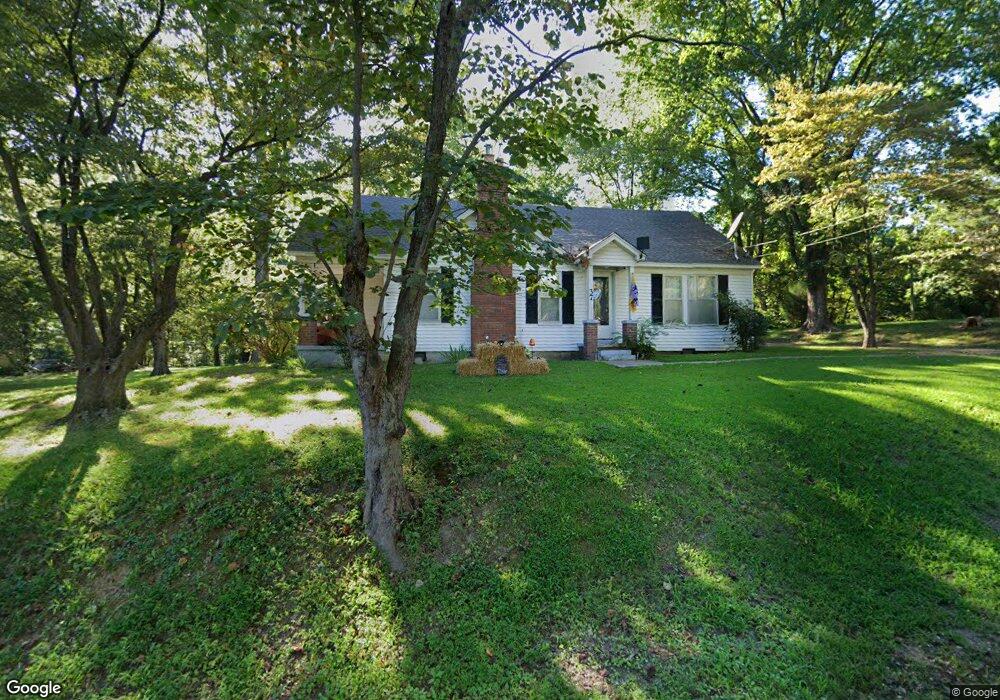
37 Curve Nankipoo Spur Rd Ripley, TN 38063
Estimated Value: $60,000 - $148,000
3
Beds
1
Bath
1,266
Sq Ft
$81/Sq Ft
Est. Value
About This Home
This home is located at 37 Curve Nankipoo Spur Rd, Ripley, TN 38063 and is currently estimated at $103,080, approximately $81 per square foot. 37 Curve Nankipoo Spur Rd is a home located in Lauderdale County with nearby schools including Halls Elementary School, Halls Junior High School, and Halls High School.
Ownership History
Date
Name
Owned For
Owner Type
Purchase Details
Closed on
Nov 28, 2012
Sold by
Morrow Jimmie Dayle
Bought by
Cullen Sean
Current Estimated Value
Purchase Details
Closed on
Mar 9, 2001
Sold by
Morrow Clara A
Bought by
Morrow Clara A
Purchase Details
Closed on
Mar 12, 1963
Bought by
Morrow Jimmie D and Morrow Bertie S
Create a Home Valuation Report for This Property
The Home Valuation Report is an in-depth analysis detailing your home's value as well as a comparison with similar homes in the area
Home Values in the Area
Average Home Value in this Area
Purchase History
| Date | Buyer | Sale Price | Title Company |
|---|---|---|---|
| Cullen Sean | $18,000 | -- | |
| Morrow Clara A | -- | -- | |
| Morrow Jimmie D | -- | -- |
Source: Public Records
Tax History Compared to Growth
Tax History
| Year | Tax Paid | Tax Assessment Tax Assessment Total Assessment is a certain percentage of the fair market value that is determined by local assessors to be the total taxable value of land and additions on the property. | Land | Improvement |
|---|---|---|---|---|
| 2025 | $198 | $7,800 | $0 | $0 |
| 2024 | $198 | $7,800 | $2,525 | $5,275 |
| 2023 | $198 | $7,800 | $2,525 | $5,275 |
| 2022 | $198 | $7,800 | $2,525 | $5,275 |
| 2021 | $198 | $7,800 | $2,525 | $5,275 |
| 2020 | $210 | $7,800 | $2,525 | $5,275 |
| 2019 | $210 | $7,125 | $3,175 | $3,950 |
| 2018 | $210 | $7,125 | $3,175 | $3,950 |
| 2017 | $207 | $6,975 | $3,175 | $3,800 |
| 2016 | $207 | $6,975 | $3,175 | $3,800 |
| 2015 | $225 | $6,975 | $3,175 | $3,800 |
| 2014 | $225 | $7,750 | $3,975 | $3,775 |
Source: Public Records
Map
Nearby Homes
- 302 Ford Store Rd
- 421 Curve Woodville Rd
- 426 Curve Woodville Rd
- 127 Harvey Newman Rd
- 622 Bluebird Hill Rd
- 000 Bluebird Hill Rd
- 2656 Curve Woodville Rd
- 176 Roy Crain Rd
- 0 Dry Hill Rd E
- 5720 Conner Whitefield Rd
- 000 Dry Hill Rd E
- 4765 Conner Whitefield Rd
- 2631 Highway 51 N
- 35 Ellis Loop
- 0 Floyd Akin Rd
- 390 Emerson Rd
- 333 Wardlow St W
- 1216 Cedar Grove Ext Rd
- 71 4th St
- 000 Conner Whitefield Rd
- 71 Curve Nankipoo Spur Rd
- 0 Ford Store Rd Unit 9998047
- 6054 Highway 209 N
- 6054 Tennessee 209
- 72 Curve Nankipoo Spur Rd
- 106 Curve Nankipoo Spur Rd
- 120 Curve Nankipoo Spur Rd
- 6125 Highway 209 N
- 6125 Tennessee 209
- 6118 Highway 209 N
- 6145 Highway 209 N
- 501 Curve Nankipoo Rd
- 6148 Highway 209 N
- 6169 Highway 209 N
- 351 Curve Nankipoo Rd
- 289 Curve Nankipoo Rd
- 305 Curve Nankipoo Rd
- 153 Ford Store Rd
- 382 Curve Nankipoo Rd
- 6206 Highway 209 N