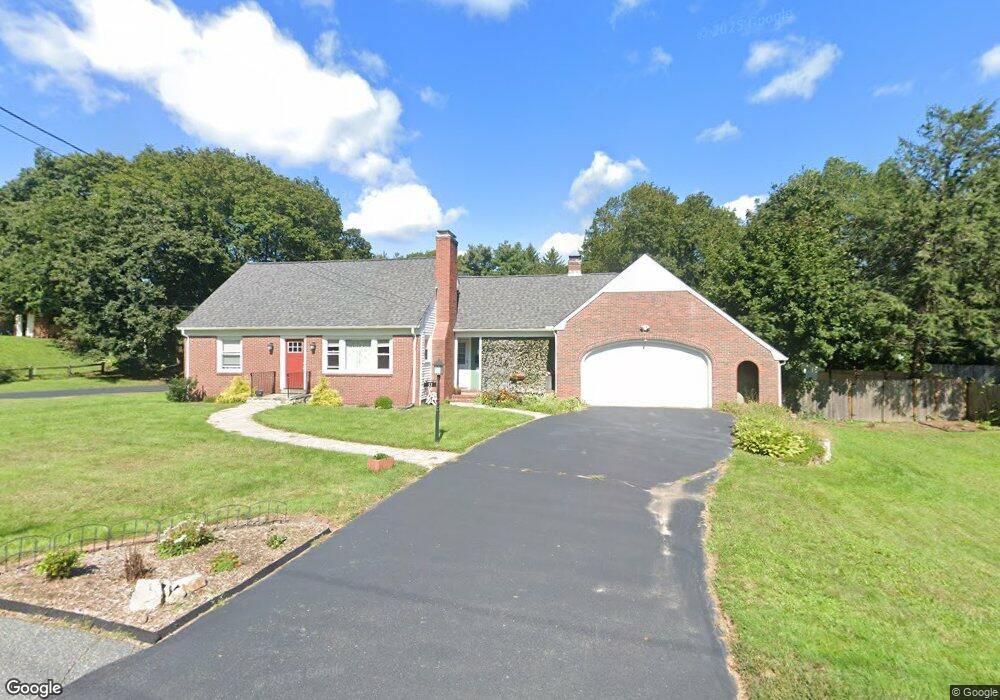
37 Curve St Natick, MA 01760
Estimated Value: $910,000 - $1,041,000
3
Beds
3
Baths
1,836
Sq Ft
$534/Sq Ft
Est. Value
About This Home
This home is located at 37 Curve St, Natick, MA 01760 and is currently estimated at $981,311, approximately $534 per square foot. 37 Curve St is a home located in Middlesex County with nearby schools including Natick High School, Johnson Elementary School, and J F Kennedy Middle School.
Ownership History
Date
Name
Owned For
Owner Type
Purchase Details
Closed on
Mar 26, 2020
Sold by
Chi Development Llc
Bought by
Mael Owen S
Current Estimated Value
Purchase Details
Closed on
Dec 2, 2019
Sold by
Henderson Shirley A Est
Bought by
Chi Development Llc
Purchase Details
Closed on
May 27, 2009
Sold by
Henderson Shirley A and Henderson Robert L
Bought by
Leverone Lawrence and Leverone Debra
Create a Home Valuation Report for This Property
The Home Valuation Report is an in-depth analysis detailing your home's value as well as a comparison with similar homes in the area
Home Values in the Area
Average Home Value in this Area
Purchase History
| Date | Buyer | Sale Price | Title Company |
|---|---|---|---|
| Mael Owen S | $700,000 | None Available | |
| Chi Development Llc | $435,000 | None Available | |
| Leverone Lawrence | -- | -- |
Source: Public Records
Tax History
| Year | Tax Paid | Tax Assessment Tax Assessment Total Assessment is a certain percentage of the fair market value that is determined by local assessors to be the total taxable value of land and additions on the property. | Land | Improvement |
|---|---|---|---|---|
| 2025 | $11,111 | $929,000 | $473,600 | $455,400 |
| 2024 | $10,724 | $874,700 | $447,300 | $427,400 |
| 2023 | $10,393 | $822,200 | $418,800 | $403,400 |
| 2022 | $10,041 | $752,700 | $380,300 | $372,400 |
| 2021 | $7,555 | $555,100 | $359,400 | $195,700 |
| 2020 | $7,343 | $539,500 | $328,200 | $211,300 |
| 2019 | $8,319 | $539,500 | $328,200 | $211,300 |
| 2018 | $6,059 | $464,300 | $312,600 | $151,700 |
| 2017 | $5,953 | $441,300 | $280,700 | $160,600 |
| 2016 | $5,765 | $424,800 | $265,700 | $159,100 |
| 2015 | $5,694 | $412,000 | $265,700 | $146,300 |
Source: Public Records
Map
Nearby Homes
Your Personal Tour Guide
Ask me questions while you tour the home.