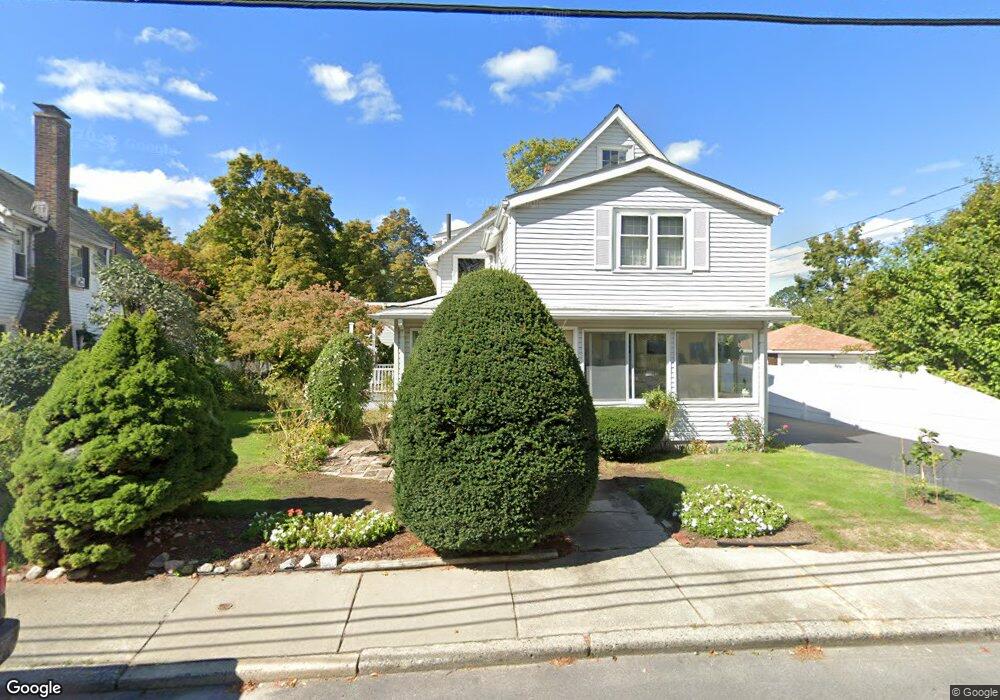
37 Curve St West Newton, MA 02465
West Newton NeighborhoodEstimated Value: $1,117,000 - $1,381,000
3
Beds
1
Bath
1,550
Sq Ft
$799/Sq Ft
Est. Value
About This Home
This home is located at 37 Curve St, West Newton, MA 02465 and is currently estimated at $1,237,989, approximately $798 per square foot. 37 Curve St is a home located in Middlesex County with nearby schools including Peirce Elementary School, Williams Elementary School, and F.A. Day Middle School.
Ownership History
Date
Name
Owned For
Owner Type
Purchase Details
Closed on
Nov 21, 2018
Sold by
Moore Austin C and Moore Dorothy M
Bought by
Handley Kevin L and Coxall Cynthia R
Current Estimated Value
Purchase Details
Closed on
Jan 24, 2018
Sold by
Kevin L Handley
Bought by
Moore Dorothy M and Moore Austin C
Home Financials for this Owner
Home Financials are based on the most recent Mortgage that was taken out on this home.
Original Mortgage
$300,000
Interest Rate
4.04%
Purchase Details
Closed on
Nov 16, 2017
Sold by
Handley Kevin L and Coxall Cynthia R
Bought by
Moore Austin C and Moore Dorothy M
Purchase Details
Closed on
Sep 3, 2014
Sold by
Moore Austin C and Moore Dorothy M
Bought by
Handley Kevin L and Coxall Cynthia R
Create a Home Valuation Report for This Property
The Home Valuation Report is an in-depth analysis detailing your home's value as well as a comparison with similar homes in the area
Home Values in the Area
Average Home Value in this Area
Purchase History
| Date | Buyer | Sale Price | Title Company |
|---|---|---|---|
| Handley Kevin L | -- | -- | |
| Moore Dorothy M | -- | -- | |
| Moore Austin C | -- | -- | |
| Handley Kevin L | -- | -- |
Source: Public Records
Mortgage History
| Date | Status | Borrower | Loan Amount |
|---|---|---|---|
| Previous Owner | Moore Dorothy M | $300,000 | |
| Previous Owner | Moore Dorothy M | -- |
Source: Public Records
Tax History Compared to Growth
Tax History
| Year | Tax Paid | Tax Assessment Tax Assessment Total Assessment is a certain percentage of the fair market value that is determined by local assessors to be the total taxable value of land and additions on the property. | Land | Improvement |
|---|---|---|---|---|
| 2025 | $9,611 | $980,700 | $848,000 | $132,700 |
| 2024 | $9,292 | $952,100 | $823,300 | $128,800 |
| 2023 | $8,850 | $869,400 | $633,400 | $236,000 |
| 2022 | $8,469 | $805,000 | $586,500 | $218,500 |
| 2021 | $8,171 | $759,400 | $553,300 | $206,100 |
| 2020 | $7,811 | $748,200 | $553,300 | $194,900 |
| 2019 | $7,292 | $697,800 | $537,200 | $160,600 |
| 2018 | $6,871 | $635,000 | $487,900 | $147,100 |
| 2017 | $6,662 | $599,100 | $460,300 | $138,800 |
| 2016 | $6,372 | $559,900 | $430,200 | $129,700 |
| 2015 | $6,076 | $523,300 | $402,100 | $121,200 |
Source: Public Records
Map
Nearby Homes
- 0 Duncan Rd Unit 72925240
- 51 Bourne St
- 17 Gilbert St
- 1488 Washington St Unit 1488
- 13 Weir St
- 1639 Washington St
- 17 Crescent St
- 10 Crescent St Unit 2
- 62-64 Rowe St Unit B
- 179 Auburn St
- 194 Auburn St
- 68 Mignon Rd
- 228 Auburn St Unit B
- 228 Auburn St Unit 230
- 283 Woodland Rd
- 66 Webster St
- 226 Auburn St Unit 226
- 224 Auburn St Unit 224
- 429 Cherry St Unit 11
- 12 Inis Cir
- 41 Curve St
- 31 Curve St
- 45 Curve St
- 45 Curve St Unit 2
- 45 Curve St Unit 1
- 45 A Curve St Unit A
- 45 B Curve Unit B
- 40 Curve St
- 34 Curve St
- 34 Curve St Unit 34
- 25 Curve St
- 49 Curve St
- 49 Curve St Unit 8
- 36 Curve St
- 46 Curve St
- 28 Curve St
- 53 Curve St
- 12 Duncan Rd Unit 14
- 12 Duncan Rd Unit 1
- 14 Duncan Rd