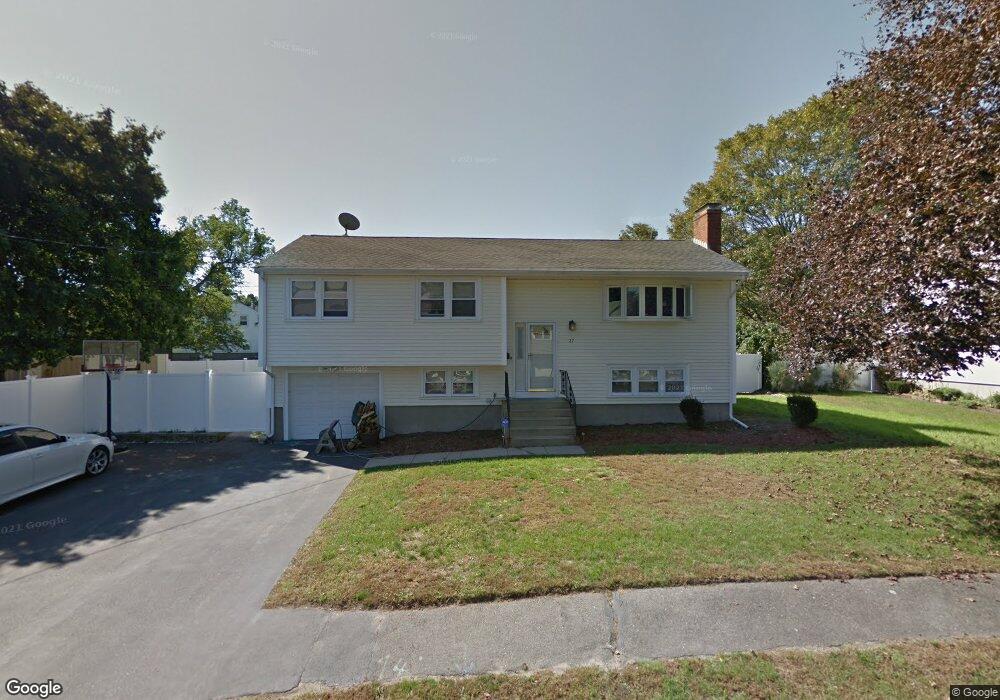
37 David Rd Needham Heights, MA 02494
Estimated Value: $944,000 - $1,225,579
3
Beds
2
Baths
1,200
Sq Ft
$929/Sq Ft
Est. Value
About This Home
This home is located at 37 David Rd, Needham Heights, MA 02494 and is currently estimated at $1,114,895, approximately $929 per square foot. 37 David Rd is a home located in Norfolk County with nearby schools including Eliot Elementary School, High Rock Middle School, and Pollard Middle School.
Ownership History
Date
Name
Owned For
Owner Type
Purchase Details
Closed on
Sep 19, 2000
Sold by
Becker Tr Donald L
Bought by
Setiabudi Danny
Current Estimated Value
Home Financials for this Owner
Home Financials are based on the most recent Mortgage that was taken out on this home.
Original Mortgage
$273,600
Interest Rate
8.07%
Mortgage Type
Purchase Money Mortgage
Create a Home Valuation Report for This Property
The Home Valuation Report is an in-depth analysis detailing your home's value as well as a comparison with similar homes in the area
Home Values in the Area
Average Home Value in this Area
Purchase History
| Date | Buyer | Sale Price | Title Company |
|---|---|---|---|
| Setiabudi Danny | $342,000 | -- |
Source: Public Records
Mortgage History
| Date | Status | Borrower | Loan Amount |
|---|---|---|---|
| Open | Setiabudi Danny | $239,000 | |
| Closed | Setiabudi Danny | $266,000 | |
| Closed | Setiabudi Danny | $273,600 |
Source: Public Records
Tax History
| Year | Tax Paid | Tax Assessment Tax Assessment Total Assessment is a certain percentage of the fair market value that is determined by local assessors to be the total taxable value of land and additions on the property. | Land | Improvement |
|---|---|---|---|---|
| 2025 | $10,496 | $990,200 | $752,800 | $237,400 |
| 2024 | $8,516 | $680,200 | $486,100 | $194,100 |
| 2023 | $8,690 | $666,400 | $486,100 | $180,300 |
| 2022 | $8,164 | $610,600 | $434,600 | $176,000 |
| 2021 | $7,956 | $610,600 | $434,600 | $176,000 |
| 2020 | $7,708 | $617,100 | $434,600 | $182,500 |
| 2019 | $7,145 | $576,700 | $395,600 | $181,100 |
| 2018 | $6,851 | $576,700 | $395,600 | $181,100 |
| 2017 | $6,608 | $555,800 | $395,600 | $160,200 |
| 2016 | $6,439 | $558,000 | $395,600 | $162,400 |
| 2015 | $6,300 | $558,000 | $395,600 | $162,400 |
| 2014 | $5,783 | $496,800 | $330,600 | $166,200 |
Source: Public Records
Map
Nearby Homes
- 5 Hazel Ln
- 108 Woodbine Cir
- 100 Woodbine Cir
- 143 Hunting Rd
- 42 Woodbine Cir
- 62 Evelyn Rd
- 23 Harvard Cir
- 28 Mercer Rd
- 48 Gary Rd
- 55 Burnside Rd
- 132 Hillside Ave
- 134 Hillside Ave Unit 134
- 4 Greenough St
- 140 Hillside Ave
- 140 Hillside Ave Unit a
- 7 West St
- 218 Hillside Ave
- 212 Central Ave
- 24 Mellen St
- 54 Indiana Terrace
Your Personal Tour Guide
Ask me questions while you tour the home.