Estimated Value: $356,000 - $394,000
2
Beds
1
Bath
1,032
Sq Ft
$361/Sq Ft
Est. Value
About This Home
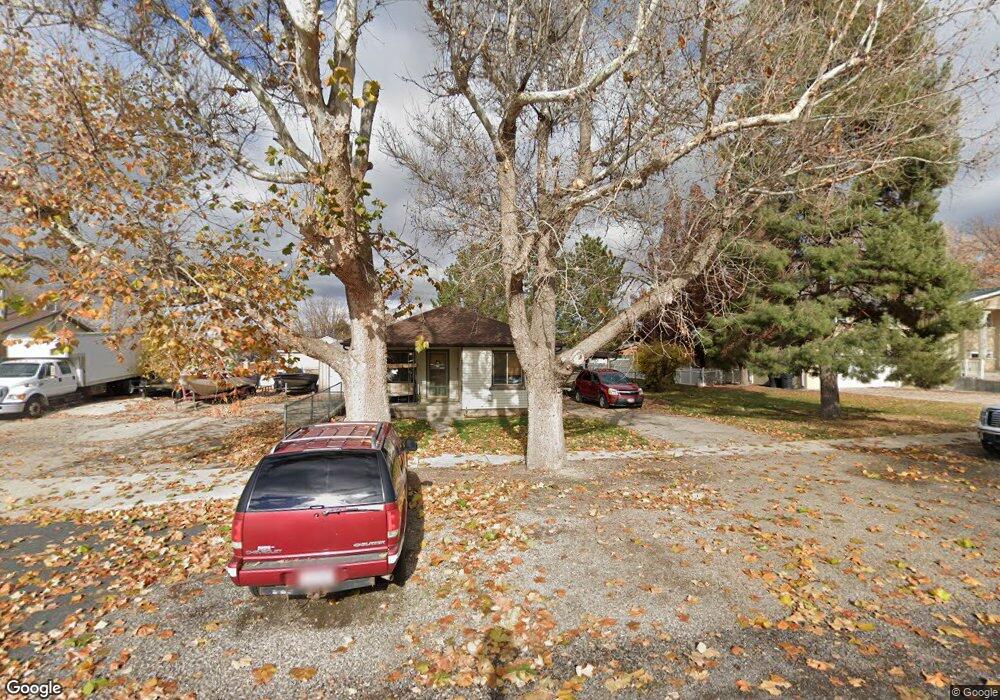
This home is located at 37 E 100 S, Salem, UT 84653 and is currently estimated at $372,853, approximately $361 per square foot. 37 E 100 S is a home located in Utah County with nearby schools including Salem Elementary, Salem Junior High School, and Valley View Middle School.
Ownership History
Date
Name
Owned For
Owner Type
Purchase Details
Closed on
Jun 20, 2003
Sold by
Hancock Brent R
Bought by
Hancock Brent R and Hancock Amber M
Current Estimated Value
Home Financials for this Owner
Home Financials are based on the most recent Mortgage that was taken out on this home.
Original Mortgage
$106,500
Outstanding Balance
$45,262
Interest Rate
5.37%
Mortgage Type
Purchase Money Mortgage
Estimated Equity
$327,591
Purchase Details
Closed on
May 23, 2001
Sold by
Hancock Brent R
Bought by
Hancock Brent R and Hancock Amber M
Home Financials for this Owner
Home Financials are based on the most recent Mortgage that was taken out on this home.
Original Mortgage
$107,670
Interest Rate
7.06%
Purchase Details
Closed on
May 22, 2001
Sold by
Eppley Shane T and Eppley Paula J
Bought by
Hancock Brent R
Home Financials for this Owner
Home Financials are based on the most recent Mortgage that was taken out on this home.
Original Mortgage
$107,670
Interest Rate
7.06%
Create a Home Valuation Report for This Property
The Home Valuation Report is an in-depth analysis detailing your home's value as well as a comparison with similar homes in the area
Home Values in the Area
Average Home Value in this Area
Purchase History
| Date | Buyer | Sale Price | Title Company |
|---|---|---|---|
| Hancock Brent R | -- | Wasatch Land & Title | |
| Hancock Brent R | -- | Wasatch Land & Title | |
| Hancock Brent R | -- | Wasatch Land & Title | |
| Hancock Brent R | -- | Wasatch Land & Title |
Source: Public Records
Mortgage History
| Date | Status | Borrower | Loan Amount |
|---|---|---|---|
| Open | Hancock Brent R | $106,500 | |
| Closed | Hancock Brent R | $107,670 |
Source: Public Records
Tax History
| Year | Tax Paid | Tax Assessment Tax Assessment Total Assessment is a certain percentage of the fair market value that is determined by local assessors to be the total taxable value of land and additions on the property. | Land | Improvement |
|---|---|---|---|---|
| 2025 | $1,630 | $181,335 | -- | -- |
| 2024 | $1,630 | $165,275 | $0 | $0 |
| 2023 | $1,594 | $161,975 | $0 | $0 |
| 2022 | $1,618 | $161,865 | $0 | $0 |
| 2021 | $1,275 | $204,600 | $94,100 | $110,500 |
| 2020 | $1,215 | $189,700 | $85,500 | $104,200 |
| 2019 | $1,081 | $172,400 | $81,800 | $90,600 |
| 2018 | $1,005 | $153,200 | $74,400 | $78,800 |
| 2017 | $906 | $73,645 | $0 | $0 |
| 2016 | $815 | $65,505 | $0 | $0 |
| 2015 | $750 | $59,180 | $0 | $0 |
| 2014 | $749 | $59,180 | $0 | $0 |
Source: Public Records
Map
Nearby Homes
- 121 S Main St
- 205 E Center St
- 412 S 100 E
- 390 S Salem Lake Dr
- 253 N 100 E
- 567 S Hazel Dr
- 432 E 300 N Unit 12
- 84 N 500 E
- 173 W 650 S Unit 10
- 481 W 705 S Unit 2
- 555 W 300 S
- 315 N 500 E
- 1223 N 360 E Unit 129
- 1212 N 360 E Unit 132
- 1195 N 360 E Unit 127
- 1241 N 360 E Unit 130
- 1238 N 360 E Unit 133
- 1207 N 360 E Unit 128
- 1165 N 360 E Unit 75
- 6 Shady Ln
Your Personal Tour Guide
Ask me questions while you tour the home.