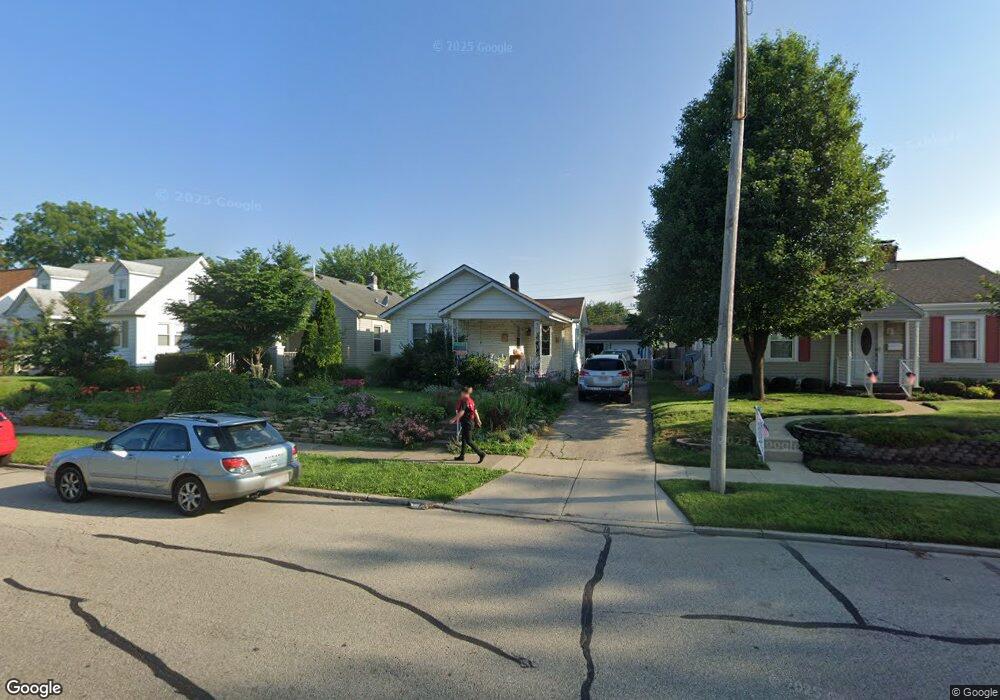
37 E Hebble Ave Fairborn, OH 45324
Estimated Value: $144,597 - $171,000
3
Beds
1
Bath
910
Sq Ft
$173/Sq Ft
Est. Value
About This Home
This home is located at 37 E Hebble Ave, Fairborn, OH 45324 and is currently estimated at $157,399, approximately $172 per square foot. 37 E Hebble Ave is a home located in Greene County with nearby schools including Fairborn Primary School, Fairborn Intermediate School, and Fairborn Middle School.
Ownership History
Date
Name
Owned For
Owner Type
Purchase Details
Closed on
May 13, 2016
Sold by
Compton William R and Compton Kristen E
Bought by
Powell Scott H
Current Estimated Value
Home Financials for this Owner
Home Financials are based on the most recent Mortgage that was taken out on this home.
Original Mortgage
$78,551
Outstanding Balance
$61,952
Interest Rate
3.87%
Mortgage Type
FHA
Estimated Equity
$95,447
Purchase Details
Closed on
May 24, 2007
Sold by
Hud
Bought by
Compton Ii William R
Home Financials for this Owner
Home Financials are based on the most recent Mortgage that was taken out on this home.
Original Mortgage
$64,336
Interest Rate
6.22%
Mortgage Type
FHA
Purchase Details
Closed on
Feb 28, 2007
Sold by
Salmons James M and Roe Richard
Bought by
Hud
Purchase Details
Closed on
Jul 10, 2000
Sold by
Legner Louis F
Bought by
Salmons James
Home Financials for this Owner
Home Financials are based on the most recent Mortgage that was taken out on this home.
Original Mortgage
$74,495
Interest Rate
8.55%
Mortgage Type
FHA
Create a Home Valuation Report for This Property
The Home Valuation Report is an in-depth analysis detailing your home's value as well as a comparison with similar homes in the area
Home Values in the Area
Average Home Value in this Area
Purchase History
| Date | Buyer | Sale Price | Title Company |
|---|---|---|---|
| Powell Scott H | $80,000 | Attorney | |
| Compton Ii William R | $64,500 | None Available | |
| Hud | $86,000 | None Available | |
| Salmons James | $74,900 | -- |
Source: Public Records
Mortgage History
| Date | Status | Borrower | Loan Amount |
|---|---|---|---|
| Open | Powell Scott H | $78,551 | |
| Previous Owner | Compton Ii William R | $64,336 | |
| Previous Owner | Salmons James | $74,495 |
Source: Public Records
Tax History
| Year | Tax Paid | Tax Assessment Tax Assessment Total Assessment is a certain percentage of the fair market value that is determined by local assessors to be the total taxable value of land and additions on the property. | Land | Improvement |
|---|---|---|---|---|
| 2025 | $1,851 | $39,290 | $9,040 | $30,250 |
| 2024 | $1,851 | $39,290 | $9,040 | $30,250 |
| 2023 | $1,837 | $39,290 | $9,040 | $30,250 |
| 2022 | $1,614 | $29,030 | $5,320 | $23,710 |
| 2021 | $1,638 | $29,030 | $5,320 | $23,710 |
| 2020 | $1,646 | $29,030 | $5,320 | $23,710 |
| 2019 | $1,274 | $22,550 | $5,010 | $17,540 |
| 2018 | $1,288 | $22,550 | $5,010 | $17,540 |
| 2017 | $1,364 | $22,550 | $5,010 | $17,540 |
| 2016 | $1,364 | $23,280 | $5,010 | $18,270 |
| 2015 | $650 | $23,280 | $5,010 | $18,270 |
| 2014 | $1,258 | $23,280 | $5,010 | $18,270 |
Source: Public Records
Map
Nearby Homes
- 106 E Hebble Ave
- 303 E Whittier Ave
- 112 Mann Ave
- 711 N Central Ave
- 261 Archer Dr
- 621 June Dr
- 801-803 Winston Dr
- 313 Archer Dr
- 112 E Xenia Dr
- 323 Mann Ave
- 308 E Xenia Dr
- 000 Morris Dr
- 388-390 Morris Dr Unit 388
- 827 Mitman Dr
- 226-230 N Broad St
- 315 W Dayton Dr
- 34 Greene St
- 315 Greene St
- 139 Hower Ln
- 1222 Oakhill Ave
- 33 E Hebble Ave
- 103 E Hebble Ave
- 29 E Hebble Ave
- 105 E Hebble Ave
- 27 E Hebble Ave
- 36 E Emerson Ave
- 32 E Emerson Ave
- 102 E Emerson Ave
- 28 E Emerson Ave
- 106 E Emerson Ave
- 36 E Hebble Ave
- 21 E Hebble Ave
- 111 E Hebble Ave
- 110 E Emerson Ave
- 24 E Emerson Ave
- 102 E Hebble Ave
- 24 E Hebble Ave
- 15 E Hebble Ave
- 119 E Hebble Ave
- 114 E Emerson Ave
Your Personal Tour Guide
Ask me questions while you tour the home.