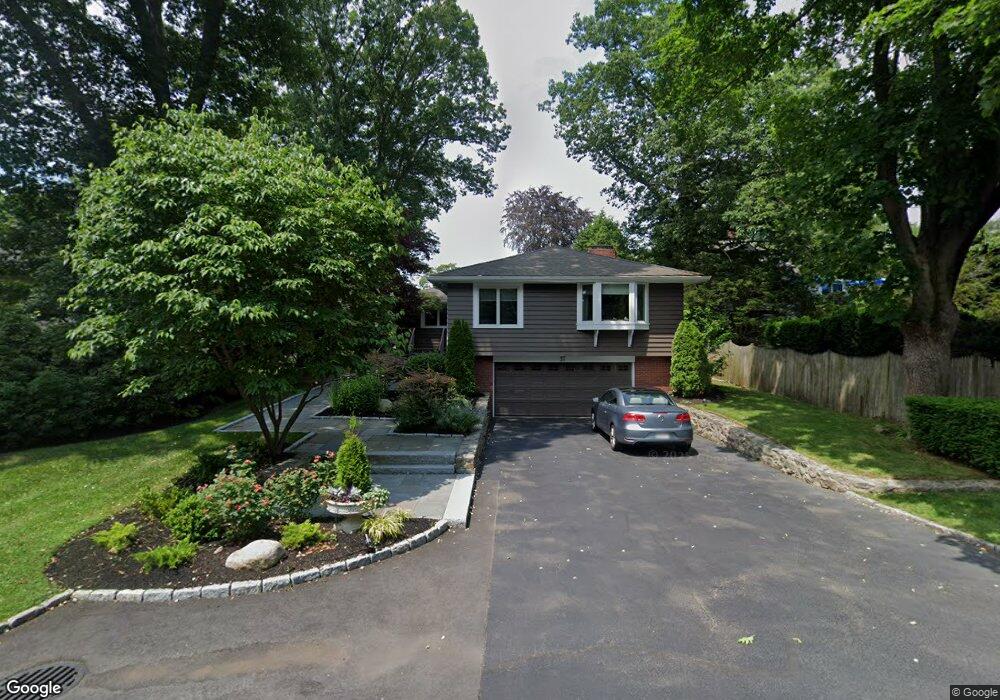
37 Estabrook Rd Swampscott, MA 01907
Estimated Value: $1,109,984 - $1,448,000
3
Beds
5
Baths
1,980
Sq Ft
$663/Sq Ft
Est. Value
About This Home
This home is located at 37 Estabrook Rd, Swampscott, MA 01907 and is currently estimated at $1,312,496, approximately $662 per square foot. 37 Estabrook Rd is a home located in Essex County with nearby schools including Swampscott Middle School, Swampscott High School, and Devereux School.
Ownership History
Date
Name
Owned For
Owner Type
Purchase Details
Closed on
Jul 19, 1999
Sold by
Revt Larry Dolinsky
Bought by
Walsh Michael K and Walsh Kerin T
Current Estimated Value
Home Financials for this Owner
Home Financials are based on the most recent Mortgage that was taken out on this home.
Original Mortgage
$303,900
Interest Rate
7.39%
Mortgage Type
Purchase Money Mortgage
Create a Home Valuation Report for This Property
The Home Valuation Report is an in-depth analysis detailing your home's value as well as a comparison with similar homes in the area
Home Values in the Area
Average Home Value in this Area
Purchase History
| Date | Buyer | Sale Price | Title Company |
|---|---|---|---|
| Walsh Michael K | $379,900 | -- | |
| Walsh Michael K | $379,900 | -- |
Source: Public Records
Mortgage History
| Date | Status | Borrower | Loan Amount |
|---|---|---|---|
| Closed | Walsh Michael K | $186,500 | |
| Closed | Walsh Michael K | $232,980 | |
| Closed | Walsh Michael K | $303,900 |
Source: Public Records
Tax History
| Year | Tax Paid | Tax Assessment Tax Assessment Total Assessment is a certain percentage of the fair market value that is determined by local assessors to be the total taxable value of land and additions on the property. | Land | Improvement |
|---|---|---|---|---|
| 2025 | $11,914 | $1,038,700 | $420,800 | $617,900 |
| 2024 | $11,452 | $996,700 | $400,200 | $596,500 |
| 2023 | $10,658 | $907,800 | $359,200 | $548,600 |
| 2022 | $9,657 | $752,700 | $307,900 | $444,800 |
| 2021 | $9,620 | $697,100 | $287,400 | $409,700 |
| 2020 | $9,866 | $689,900 | $287,400 | $402,500 |
| 2019 | $10,186 | $670,100 | $266,800 | $403,300 |
| 2018 | $10,722 | $670,100 | $266,800 | $403,300 |
| 2017 | $10,905 | $624,900 | $246,300 | $378,600 |
| 2016 | $10,696 | $617,200 | $238,600 | $378,600 |
| 2015 | $10,585 | $617,200 | $238,600 | $378,600 |
| 2014 | $9,288 | $496,700 | $238,600 | $258,100 |
Source: Public Records
Map
Nearby Homes
- 11 Elbridge Ln Unit 11
- 2 Ocean Ave
- 212 Humphrey St Unit 205
- 16 Pickwick Rd
- 12 Pickwick Rd
- 11 Angenica Terrace
- 35 Alden Rd
- 22 Hemenway Rd
- 1008 Paradise Rd Unit 1M
- 4 Dean Rd
- 469 Loring Ave
- 1002 Paradise Rd Unit PHE
- 1004 Paradise Rd Unit 1K
- 1004 Paradise Rd Unit 1L
- 71 Walnut Rd
- 10 Arbutus Rd
- 110 Galloupes Point Rd
- 315 Puritan Rd
- 3 Didio Dr
- 50 Mountwood Rd
Your Personal Tour Guide
Ask me questions while you tour the home.