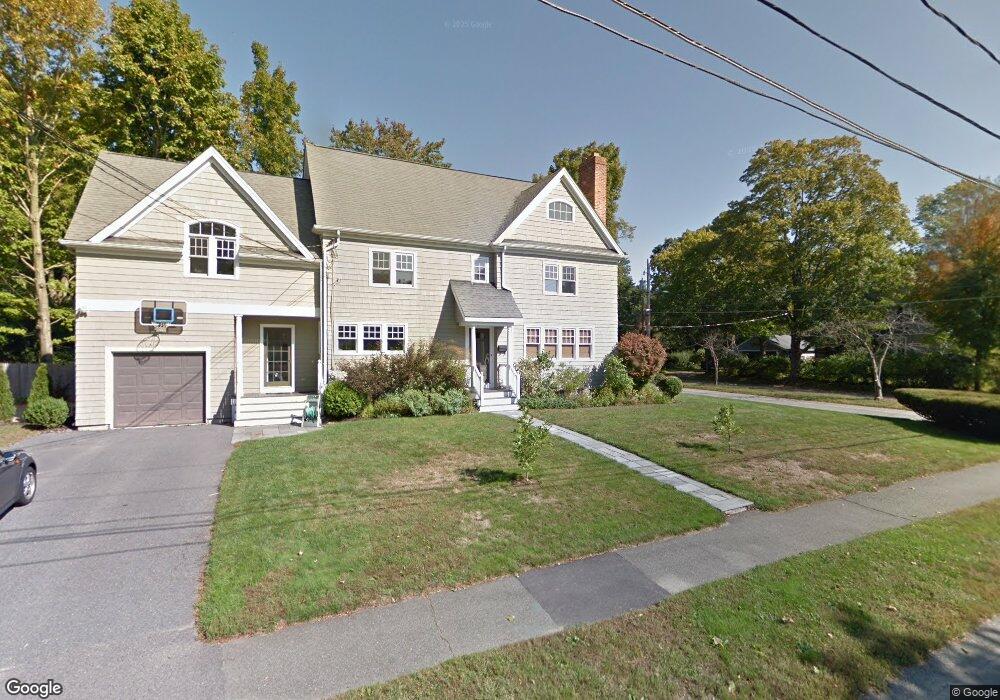
37 Fair Oaks Park Needham, MA 02492
Estimated Value: $1,211,000 - $1,681,000
4
Beds
2
Baths
1,010
Sq Ft
$1,427/Sq Ft
Est. Value
About This Home
This home is located at 37 Fair Oaks Park, Needham, MA 02492 and is currently estimated at $1,440,951, approximately $1,426 per square foot. 37 Fair Oaks Park is a home located in Norfolk County with nearby schools including High Rock Middle School, Sunita L. Williams Elementary School, and Pollard Middle School.
Ownership History
Date
Name
Owned For
Owner Type
Purchase Details
Closed on
Aug 19, 2022
Sold by
Caine Michael E
Bought by
Michael E Caine 2022 Ret
Current Estimated Value
Create a Home Valuation Report for This Property
The Home Valuation Report is an in-depth analysis detailing your home's value as well as a comparison with similar homes in the area
Home Values in the Area
Average Home Value in this Area
Purchase History
| Date | Buyer | Sale Price | Title Company |
|---|---|---|---|
| Michael E Caine 2022 Ret | -- | None Available |
Source: Public Records
Tax History Compared to Growth
Tax History
| Year | Tax Paid | Tax Assessment Tax Assessment Total Assessment is a certain percentage of the fair market value that is determined by local assessors to be the total taxable value of land and additions on the property. | Land | Improvement |
|---|---|---|---|---|
| 2025 | $14,627 | $1,379,900 | $920,300 | $459,600 |
| 2024 | $11,188 | $893,600 | $593,700 | $299,900 |
| 2023 | $11,383 | $872,900 | $593,700 | $279,200 |
| 2022 | $10,887 | $814,300 | $544,700 | $269,600 |
| 2021 | $10,610 | $814,300 | $544,700 | $269,600 |
| 2020 | $9,968 | $798,100 | $545,400 | $252,700 |
| 2019 | $9,242 | $745,900 | $495,800 | $250,100 |
| 2018 | $8,861 | $745,900 | $495,800 | $250,100 |
| 2017 | $8,528 | $717,200 | $495,800 | $221,400 |
| 2016 | $8,304 | $719,600 | $495,800 | $223,800 |
| 2015 | $8,124 | $719,600 | $495,800 | $223,800 |
| 2014 | $7,758 | $666,500 | $470,700 | $195,800 |
Source: Public Records
Map
Nearby Homes
- 40 Otis St Unit L
- 42 Otis St Unit R
- 154 Warren St
- 556 Webster St
- 71 School St
- 26 Pinewood Rd
- 233 Warren St
- 62 Washington Ave
- 190 Brookline St
- 100 Rosemary Way Unit 129
- 100 Rosemary Way Unit 324
- 445 Hillside Ave
- 1011 Webster St
- 332 Hillcrest Rd
- 3 Crescent Rd
- 39 Mark Lee Rd
- 34 Pershing Rd
- 400 Hunnewell St Unit 103
- 379 Hunnewell St Unit 379
- 23 Cheney St