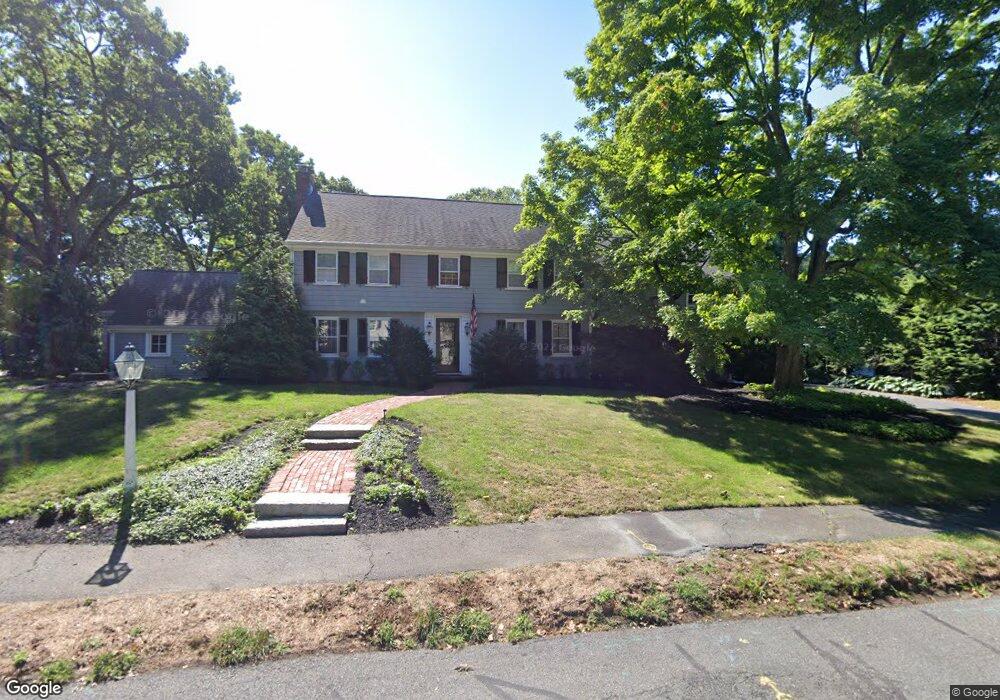
37 Fiske Rd Wellesley Hills, MA 02481
Wellesley Hills NeighborhoodEstimated Value: $2,216,477 - $2,888,000
4
Beds
5
Baths
3,727
Sq Ft
$684/Sq Ft
Est. Value
About This Home
This home is located at 37 Fiske Rd, Wellesley Hills, MA 02481 and is currently estimated at $2,550,119, approximately $684 per square foot. 37 Fiske Rd is a home located in Norfolk County with nearby schools including Schofield Elementary School, Wellesley Middle School, and Wellesley Sr High School.
Ownership History
Date
Name
Owned For
Owner Type
Purchase Details
Closed on
Sep 2, 2004
Sold by
Taplin Jennifer and Taplin Todd F
Bought by
Taplin Rt
Current Estimated Value
Purchase Details
Closed on
Feb 28, 2000
Sold by
Stevenson Nancy D
Bought by
Taplin Todd F and Taplin Jennifer
Home Financials for this Owner
Home Financials are based on the most recent Mortgage that was taken out on this home.
Original Mortgage
$434,000
Interest Rate
8.15%
Mortgage Type
Purchase Money Mortgage
Create a Home Valuation Report for This Property
The Home Valuation Report is an in-depth analysis detailing your home's value as well as a comparison with similar homes in the area
Home Values in the Area
Average Home Value in this Area
Purchase History
| Date | Buyer | Sale Price | Title Company |
|---|---|---|---|
| Taplin Rt | -- | -- | |
| Taplin Todd F | $934,000 | -- |
Source: Public Records
Mortgage History
| Date | Status | Borrower | Loan Amount |
|---|---|---|---|
| Previous Owner | Taplin Todd F | $434,000 |
Source: Public Records
Tax History Compared to Growth
Tax History
| Year | Tax Paid | Tax Assessment Tax Assessment Total Assessment is a certain percentage of the fair market value that is determined by local assessors to be the total taxable value of land and additions on the property. | Land | Improvement |
|---|---|---|---|---|
| 2025 | $19,398 | $1,887,000 | $1,305,000 | $582,000 |
| 2024 | $18,384 | $1,766,000 | $1,205,000 | $561,000 |
| 2023 | $17,438 | $1,523,000 | $1,075,000 | $448,000 |
| 2022 | $17,660 | $1,512,000 | $930,000 | $582,000 |
| 2021 | $16,591 | $1,412,000 | $830,000 | $582,000 |
| 2020 | $16,323 | $1,412,000 | $830,000 | $582,000 |
| 2019 | $15,400 | $1,331,000 | $764,000 | $567,000 |
| 2018 | $16,192 | $1,355,000 | $738,000 | $617,000 |
| 2017 | $15,975 | $1,355,000 | $738,000 | $617,000 |
| 2016 | $15,769 | $1,333,000 | $726,000 | $607,000 |
| 2015 | $15,398 | $1,332,000 | $725,000 | $607,000 |
Source: Public Records
Map
Nearby Homes
- 7 Crescent St
- 2 Longfellow Rd
- 12 Bird Hill Ave
- 20 Oakland Street Front
- 25 Columbia St
- 45 Moulton St
- 45 E Quinobequin Rd
- 6 Oakland Cir
- 177 Varick Rd
- 34 Palmer Rd
- 6 Willow St
- 206 Cedar St
- 10 Fife Rd
- 2084 Washington St
- 310 Oakland St
- 78 Hunnewell St
- 54 Colburn Rd
- 17 Deforest Rd
- 10 Lorraine Cir
- 46 Lincoln Rd