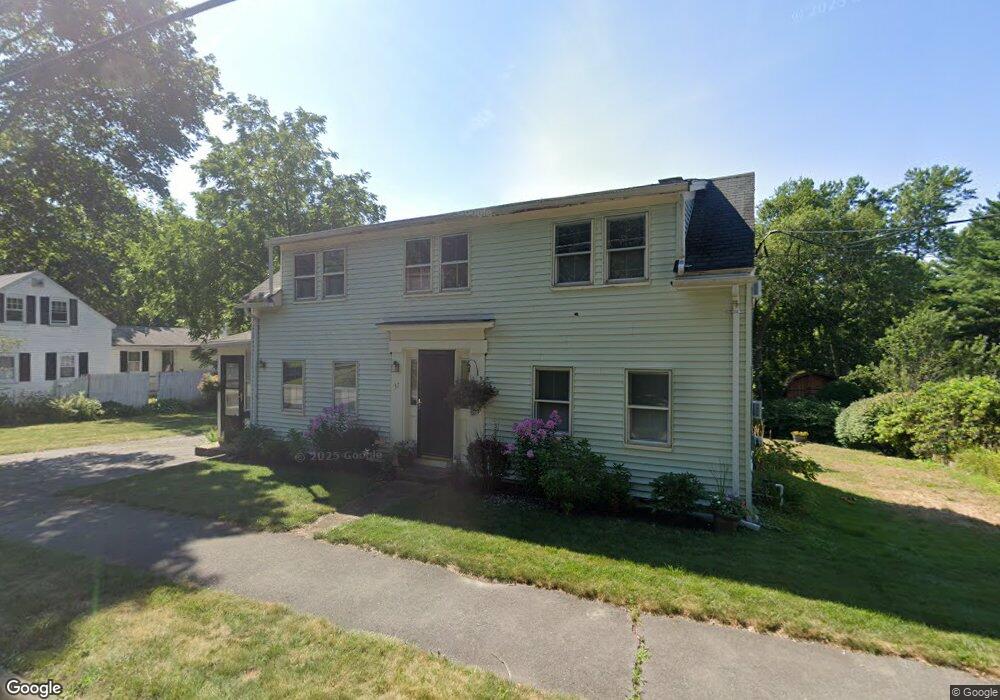
37 Forest St Danvers, MA 01923
Estimated Value: $567,000 - $667,000
2
Beds
1
Bath
1,469
Sq Ft
$426/Sq Ft
Est. Value
About This Home
This home is located at 37 Forest St, Danvers, MA 01923 and is currently estimated at $625,435, approximately $425 per square foot. 37 Forest St is a home located in Essex County with nearby schools including Danvers High School, St. Mary of the Annunciation School, and Plumfield Academy.
Ownership History
Date
Name
Owned For
Owner Type
Purchase Details
Closed on
May 16, 1997
Sold by
Crawford Mark and Crawford Stacy
Bought by
Flynn Brian R
Current Estimated Value
Home Financials for this Owner
Home Financials are based on the most recent Mortgage that was taken out on this home.
Original Mortgage
$151,905
Interest Rate
8.12%
Mortgage Type
Purchase Money Mortgage
Purchase Details
Closed on
May 28, 1993
Sold by
Neidhardt Peter and Neidhardt Edith
Bought by
Crawford Mark D
Home Financials for this Owner
Home Financials are based on the most recent Mortgage that was taken out on this home.
Original Mortgage
$124,200
Interest Rate
7.41%
Mortgage Type
Purchase Money Mortgage
Purchase Details
Closed on
Feb 29, 1988
Sold by
Henshaw Vickie P
Bought by
Neidhardt Peter P
Create a Home Valuation Report for This Property
The Home Valuation Report is an in-depth analysis detailing your home's value as well as a comparison with similar homes in the area
Home Values in the Area
Average Home Value in this Area
Purchase History
| Date | Buyer | Sale Price | Title Company |
|---|---|---|---|
| Flynn Brian R | $159,900 | -- | |
| Crawford Mark D | $138,000 | -- | |
| Neidhardt Peter P | $143,500 | -- |
Source: Public Records
Mortgage History
| Date | Status | Borrower | Loan Amount |
|---|---|---|---|
| Open | Neidhardt Peter P | $151,900 | |
| Closed | Neidhardt Peter P | $151,905 | |
| Previous Owner | Neidhardt Peter P | $124,200 | |
| Previous Owner | Neidhardt Peter P | $11,549 |
Source: Public Records
Tax History Compared to Growth
Tax History
| Year | Tax Paid | Tax Assessment Tax Assessment Total Assessment is a certain percentage of the fair market value that is determined by local assessors to be the total taxable value of land and additions on the property. | Land | Improvement |
|---|---|---|---|---|
| 2025 | $5,916 | $538,300 | $348,000 | $190,300 |
| 2024 | $5,898 | $530,900 | $348,000 | $182,900 |
| 2023 | $5,713 | $486,200 | $316,200 | $170,000 |
| 2022 | $5,615 | $443,500 | $286,900 | $156,600 |
| 2021 | $5,443 | $407,700 | $271,800 | $135,900 |
| 2020 | $5,262 | $402,900 | $268,600 | $134,300 |
| 2019 | $5,076 | $382,200 | $244,200 | $138,000 |
| 2018 | $4,906 | $362,300 | $241,800 | $120,500 |
| 2017 | $4,637 | $326,800 | $211,200 | $115,600 |
| 2016 | $4,450 | $313,400 | $201,500 | $111,900 |
| 2015 | $4,290 | $287,700 | $183,100 | $104,600 |
Source: Public Records
Map
Nearby Homes
- 11 Spring St
- 4 Briarwood Dr
- 267 Centre St
- 39 Roosevelt Ave
- 320 Newbury St Unit 304
- 103 Newbury St Unit 3
- 103 Newbury St Unit 1
- 6 Kimberly Dr
- 98 Newbury St Unit 4B
- 98 Newbury St Unit 18B
- 96 Newbury St Unit 6B
- 22 Collins St Unit 31
- 14 Williams St Unit C17
- 2 Pat Dr
- 4 Butler Ave
- 35 Locust St Unit 3
- 10 Paulette Dr
- 78 North St
- 57 Adams St
- 12 Central Ave Unit 1