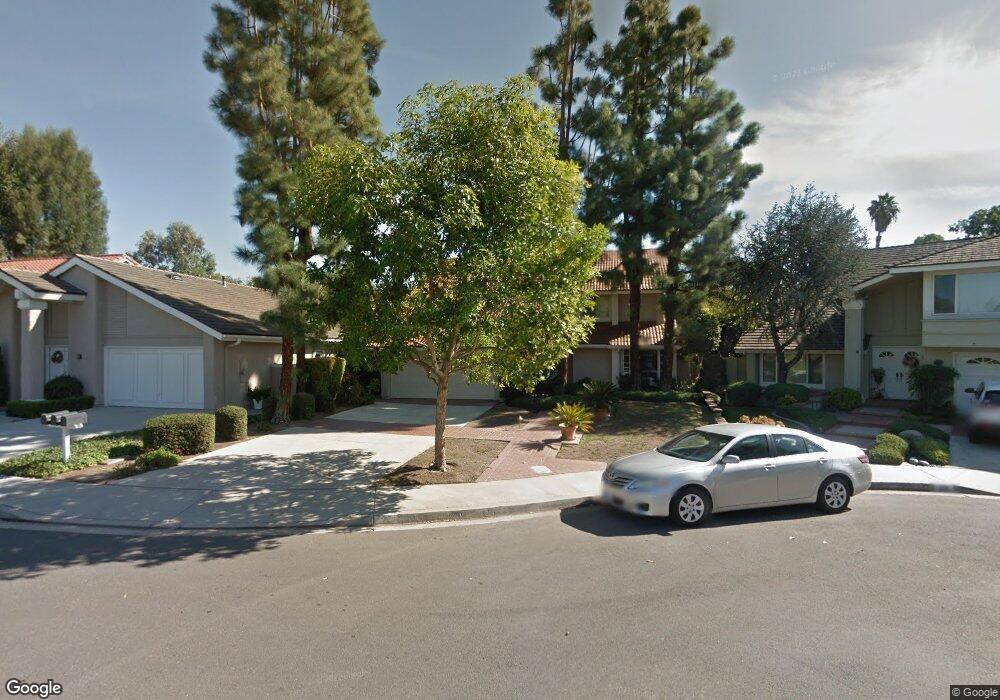
37 Fortuna E Irvine, CA 92620
Northwood NeighborhoodEstimated Value: $1,854,659 - $2,081,000
4
Beds
3
Baths
2,337
Sq Ft
$832/Sq Ft
Est. Value
About This Home
This home is located at 37 Fortuna E, Irvine, CA 92620 and is currently estimated at $1,944,415, approximately $832 per square foot. 37 Fortuna E is a home located in Orange County with nearby schools including Santiago Hills Elementary School, Sierra Vista Middle School, and Northwood High School.
Ownership History
Date
Name
Owned For
Owner Type
Purchase Details
Closed on
Sep 12, 2008
Sold by
Morris Leigh Anna
Bought by
Morris Leigh Anna and Leigh Anna Morris Living Trust
Current Estimated Value
Purchase Details
Closed on
Aug 5, 2005
Sold by
Torres Marvin Antonio and Torres Maria Elena
Bought by
Morris Leigh A
Home Financials for this Owner
Home Financials are based on the most recent Mortgage that was taken out on this home.
Original Mortgage
$692,000
Interest Rate
5.5%
Mortgage Type
Purchase Money Mortgage
Purchase Details
Closed on
Oct 1, 1998
Sold by
Edge Richard S and Edge Betty J
Bought by
Torres Marvin Antonio and Torres Maria Elena
Home Financials for this Owner
Home Financials are based on the most recent Mortgage that was taken out on this home.
Original Mortgage
$312,000
Interest Rate
6.62%
Create a Home Valuation Report for This Property
The Home Valuation Report is an in-depth analysis detailing your home's value as well as a comparison with similar homes in the area
Home Values in the Area
Average Home Value in this Area
Purchase History
| Date | Buyer | Sale Price | Title Company |
|---|---|---|---|
| Morris Leigh Anna | -- | None Available | |
| Morris Leigh A | $865,000 | Chicago Title Company | |
| Torres Marvin Antonio | $390,000 | Old Republic Title Company |
Source: Public Records
Mortgage History
| Date | Status | Borrower | Loan Amount |
|---|---|---|---|
| Previous Owner | Morris Leigh A | $692,000 | |
| Previous Owner | Torres Marvin Antonio | $312,000 | |
| Closed | Torres Marvin Antonio | $39,000 |
Source: Public Records
Tax History
| Year | Tax Paid | Tax Assessment Tax Assessment Total Assessment is a certain percentage of the fair market value that is determined by local assessors to be the total taxable value of land and additions on the property. | Land | Improvement |
|---|---|---|---|---|
| 2025 | $12,135 | $1,182,089 | $949,329 | $232,760 |
| 2024 | $12,135 | $1,158,911 | $930,714 | $228,197 |
| 2023 | $11,821 | $1,136,188 | $912,465 | $223,723 |
| 2022 | $11,600 | $1,113,910 | $894,573 | $219,337 |
| 2021 | $11,337 | $1,092,069 | $877,032 | $215,037 |
| 2020 | $11,273 | $1,080,872 | $868,039 | $212,833 |
| 2019 | $11,022 | $1,059,679 | $851,019 | $208,660 |
| 2018 | $10,830 | $1,038,901 | $834,332 | $204,569 |
| 2017 | $10,157 | $975,000 | $801,263 | $173,737 |
| 2016 | $9,894 | $975,000 | $801,263 | $173,737 |
| 2015 | $8,684 | $859,950 | $686,213 | $173,737 |
| 2014 | $8,683 | $859,950 | $686,213 | $173,737 |
Source: Public Records
Map
Nearby Homes
Your Personal Tour Guide
Ask me questions while you tour the home.