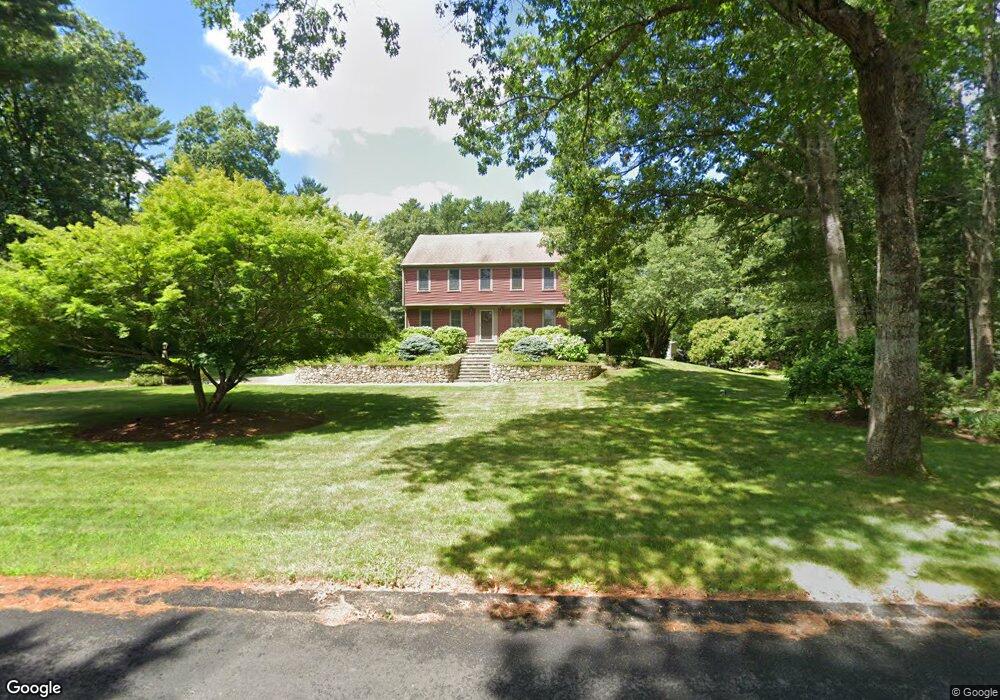
37 Gerrish Rd Rochester, MA 02770
Estimated Value: $753,747 - $843,000
4
Beds
3
Baths
2,592
Sq Ft
$305/Sq Ft
Est. Value
About This Home
This home is located at 37 Gerrish Rd, Rochester, MA 02770 and is currently estimated at $789,937, approximately $304 per square foot. 37 Gerrish Rd is a home located in Plymouth County with nearby schools including Rochester Memorial School and Old Rochester Regional High School.
Ownership History
Date
Name
Owned For
Owner Type
Purchase Details
Closed on
Jan 19, 2024
Sold by
Deverix Michael J
Bought by
Deverix Michael J
Current Estimated Value
Purchase Details
Closed on
Oct 13, 2009
Sold by
Deverix Michael J and Deverix Nataly Jennifer
Bought by
Deverix Michael J and Deverix Nataly Jennifer
Home Financials for this Owner
Home Financials are based on the most recent Mortgage that was taken out on this home.
Original Mortgage
$219,000
Interest Rate
5.19%
Purchase Details
Closed on
Oct 12, 2006
Sold by
Deverix Michael J
Bought by
Deverix Michael J and Deverix Nataly Jennifer
Purchase Details
Closed on
Apr 4, 2001
Sold by
Heimbinder David A and Striegel Cathy A
Bought by
Deverix Michael J and Deverix Judy A
Purchase Details
Closed on
May 5, 2000
Sold by
Hart Russell D and Hart Karen J
Bought by
Heimbinder David A and Striegel Cathy A
Create a Home Valuation Report for This Property
The Home Valuation Report is an in-depth analysis detailing your home's value as well as a comparison with similar homes in the area
Home Values in the Area
Average Home Value in this Area
Purchase History
| Date | Buyer | Sale Price | Title Company |
|---|---|---|---|
| Deverix Michael J | -- | None Available | |
| Deverix Michael J | -- | None Available | |
| Deverix Michael J | -- | -- | |
| Deverix Michael J | -- | -- | |
| Deverix Michael J | $322,000 | -- | |
| Heimbinder David A | $304,000 | -- |
Source: Public Records
Mortgage History
| Date | Status | Borrower | Loan Amount |
|---|---|---|---|
| Previous Owner | Heimbinder David A | $219,000 | |
| Previous Owner | Heimbinder David A | $100,000 |
Source: Public Records
Tax History
| Year | Tax Paid | Tax Assessment Tax Assessment Total Assessment is a certain percentage of the fair market value that is determined by local assessors to be the total taxable value of land and additions on the property. | Land | Improvement |
|---|---|---|---|---|
| 2025 | $7,506 | $693,700 | $228,900 | $464,800 |
| 2024 | $7,370 | $666,400 | $218,000 | $448,400 |
| 2023 | $7,082 | $596,600 | $218,000 | $378,600 |
| 2022 | $6,901 | $541,700 | $275,000 | $266,700 |
| 2021 | $6,593 | $493,100 | $251,000 | $242,100 |
| 2020 | $6,474 | $480,300 | $243,200 | $237,100 |
| 2019 | $6,416 | $458,300 | $228,300 | $230,000 |
| 2018 | $6,218 | $440,700 | $206,400 | $234,300 |
| 2017 | $6,201 | $430,900 | $191,700 | $239,200 |
| 2016 | $6,194 | $442,100 | $206,500 | $235,600 |
| 2015 | $6,035 | $428,900 | $206,500 | $222,400 |
| 2014 | $5,624 | $406,100 | $177,800 | $228,300 |
Source: Public Records
Map
Nearby Homes
- 536 North Ave
- 562 North Ave
- 709 Walnut Plain Rd
- 247 Braley Hill Rd
- 7 Randall Rd
- 1-3 Doctor Hickey Ln
- 18 Wordell St
- 199 Quaker Ln
- 57 Long Point Rd Unit 208
- 57 Long Point Rd Unit 104
- 3 Abraham Ave
- 558 Wareham St
- 146 Miller St
- 571 Wareham St
- 167 Old Miller St
- 28 Wareham St
- 1 Rounseville Rd
- 618 Wareham St
- 120 Hackett Ave
- 234 Walnut Plain Rd
Your Personal Tour Guide
Ask me questions while you tour the home.