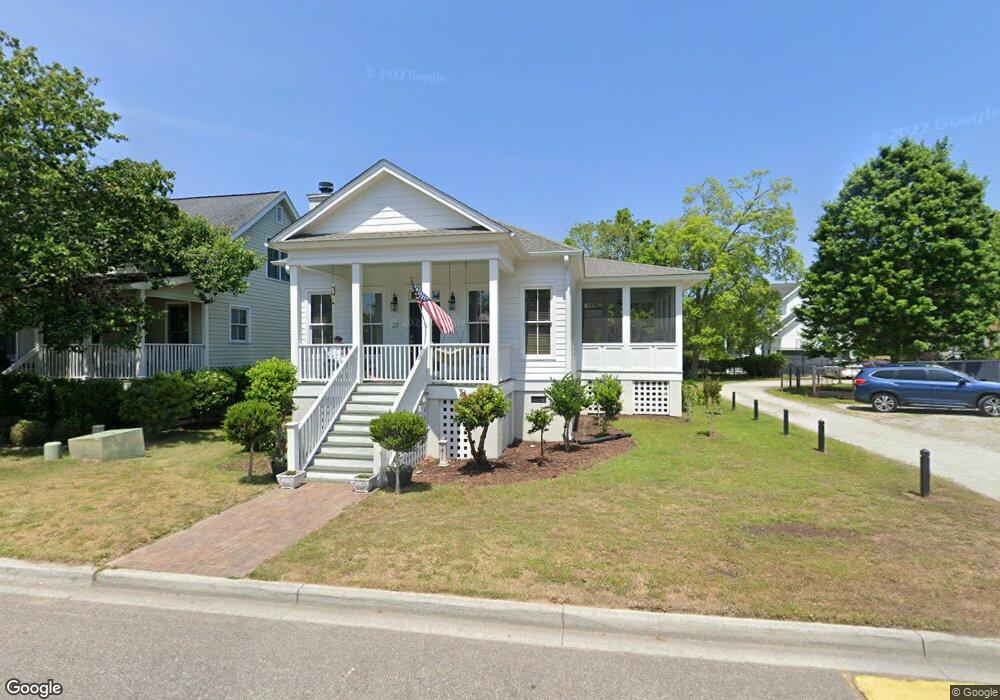
37 Holbrook Dr Beaufort, SC 29902
Estimated Value: $435,806 - $551,000
3
Beds
2
Baths
1,560
Sq Ft
$319/Sq Ft
Est. Value
About This Home
This home is located at 37 Holbrook Dr, Beaufort, SC 29902 and is currently estimated at $498,202, approximately $319 per square foot. 37 Holbrook Dr is a home located in Beaufort County with nearby schools including Beaufort Elementary School, Beaufort Middle School, and Battery Creek High School.
Ownership History
Date
Name
Owned For
Owner Type
Purchase Details
Closed on
Mar 20, 2007
Sold by
Fredell Wendy K
Bought by
Miller Bobby Ray and Miller Doretta Kenney
Current Estimated Value
Purchase Details
Closed on
Aug 26, 2004
Sold by
Rolfe Peter E and Denham Caroline S
Bought by
Fredell Wendy K
Purchase Details
Closed on
Jul 1, 2003
Sold by
Structural Images Inc
Bought by
Rolfe Peter E and Denham Caroline S
Home Financials for this Owner
Home Financials are based on the most recent Mortgage that was taken out on this home.
Original Mortgage
$190,400
Interest Rate
5.29%
Mortgage Type
Purchase Money Mortgage
Purchase Details
Closed on
Dec 6, 2002
Sold by
Mcneal J Bennett
Bought by
Structural Images Inc
Home Financials for this Owner
Home Financials are based on the most recent Mortgage that was taken out on this home.
Original Mortgage
$168,000
Interest Rate
6.08%
Mortgage Type
Construction
Create a Home Valuation Report for This Property
The Home Valuation Report is an in-depth analysis detailing your home's value as well as a comparison with similar homes in the area
Home Values in the Area
Average Home Value in this Area
Purchase History
| Date | Buyer | Sale Price | Title Company |
|---|---|---|---|
| Miller Bobby Ray | $288,000 | None Available | |
| Fredell Wendy K | $265,000 | -- | |
| Rolfe Peter E | $241,065 | -- | |
| Structural Images Inc | $36,000 | -- |
Source: Public Records
Mortgage History
| Date | Status | Borrower | Loan Amount |
|---|---|---|---|
| Previous Owner | Rolfe Peter E | $190,400 | |
| Previous Owner | Structural Images Inc | $168,000 |
Source: Public Records
Tax History Compared to Growth
Tax History
| Year | Tax Paid | Tax Assessment Tax Assessment Total Assessment is a certain percentage of the fair market value that is determined by local assessors to be the total taxable value of land and additions on the property. | Land | Improvement |
|---|---|---|---|---|
| 2024 | $412 | $17,896 | $2,840 | $15,056 |
| 2023 | $412 | $17,896 | $2,840 | $15,056 |
| 2022 | $142 | $10,680 | $2,104 | $8,576 |
| 2021 | $142 | $10,680 | $2,104 | $8,576 |
| 2020 | $142 | $10,680 | $2,104 | $8,576 |
| 2019 | $142 | $10,680 | $2,104 | $8,576 |
| 2018 | $141 | $10,210 | $0 | $0 |
| 2017 | $111 | $8,880 | $0 | $0 |
| 2016 | $1,257 | $8,880 | $0 | $0 |
| 2014 | $1,380 | $8,880 | $0 | $0 |
Source: Public Records
Map
Nearby Homes