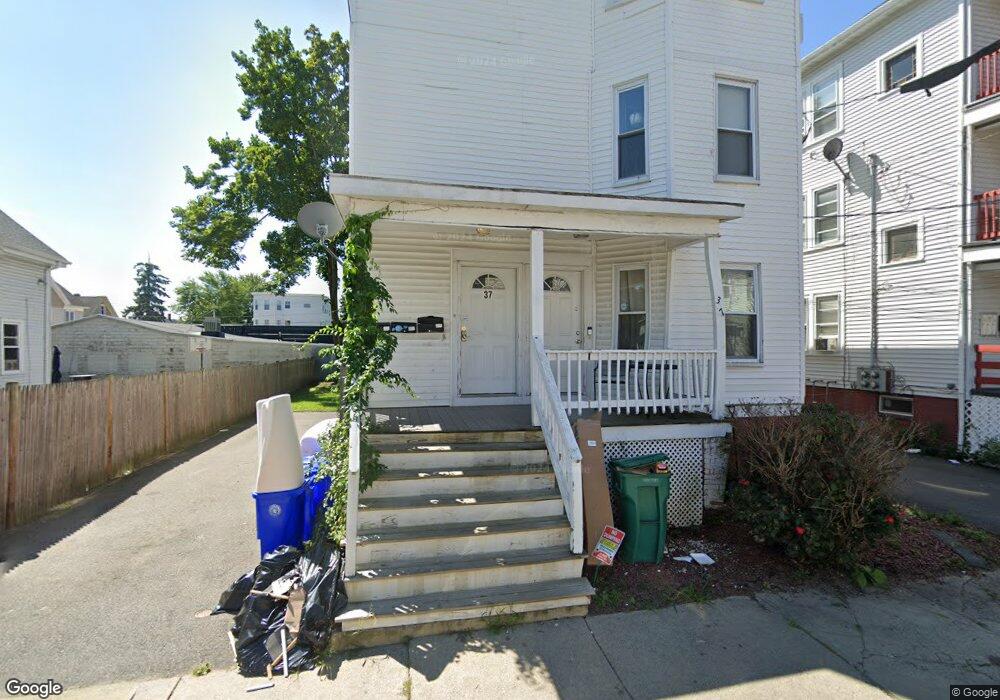
37 Holman St Unit 2 Attleboro, MA 02703
Estimated Value: $629,285 - $671,000
2
Beds
1
Bath
1,000
Sq Ft
$658/Sq Ft
Est. Value
About This Home
This home is located at 37 Holman St Unit 2, Attleboro, MA 02703 and is currently estimated at $658,321, approximately $658 per square foot. 37 Holman St Unit 2 is a home located in Bristol County with nearby schools including Hyman Fine Elementary School, Wamsutta Middle School, and Attleboro High School.
Ownership History
Date
Name
Owned For
Owner Type
Purchase Details
Closed on
Aug 31, 2009
Sold by
Webster Bk
Bought by
Caban Vanessa
Current Estimated Value
Home Financials for this Owner
Home Financials are based on the most recent Mortgage that was taken out on this home.
Original Mortgage
$235,653
Outstanding Balance
$153,959
Interest Rate
5.17%
Mortgage Type
Purchase Money Mortgage
Estimated Equity
$504,362
Purchase Details
Closed on
Jun 16, 2009
Sold by
Soto Mark D and Webster Bk
Bought by
Webster Bk
Create a Home Valuation Report for This Property
The Home Valuation Report is an in-depth analysis detailing your home's value as well as a comparison with similar homes in the area
Home Values in the Area
Average Home Value in this Area
Purchase History
| Date | Buyer | Sale Price | Title Company |
|---|---|---|---|
| Caban Vanessa | $240,000 | -- | |
| Webster Bk | $225,000 | -- |
Source: Public Records
Mortgage History
| Date | Status | Borrower | Loan Amount |
|---|---|---|---|
| Open | Caban Vanessa | $235,653 |
Source: Public Records
Tax History
| Year | Tax Paid | Tax Assessment Tax Assessment Total Assessment is a certain percentage of the fair market value that is determined by local assessors to be the total taxable value of land and additions on the property. | Land | Improvement |
|---|---|---|---|---|
| 2025 | $8,777 | $699,400 | $105,600 | $593,800 |
| 2024 | $8,393 | $659,300 | $105,600 | $553,700 |
| 2023 | $7,326 | $535,100 | $96,000 | $439,100 |
| 2022 | $6,521 | $451,300 | $91,500 | $359,800 |
| 2021 | $5,365 | $362,500 | $87,900 | $274,600 |
| 2020 | $5,003 | $343,600 | $85,300 | $258,300 |
| 2019 | $4,720 | $333,300 | $83,700 | $249,600 |
| 2018 | $4,267 | $287,900 | $81,300 | $206,600 |
| 2017 | $4,189 | $287,900 | $81,300 | $206,600 |
| 2016 | $3,751 | $253,100 | $75,900 | $177,200 |
| 2015 | $3,504 | $238,200 | $75,900 | $162,300 |
| 2014 | $3,215 | $216,500 | $71,900 | $144,600 |
Source: Public Records
Map
Nearby Homes
- 37 Holman St Unit 3
- 37 Holman St Unit 1
- 35 Holman St
- 35 Holman St Unit 1
- 35 Holman St Unit 2
- 39 Holman St
- 40 Emory St
- 33 Holman St
- 33 Holman St Unit B
- 41 Holman St
- 36 Emory St
- 36 Emory St Unit St
- 36 Emory St Unit 2
- 40 Holman St
- 38 Holman St
- 42 Holman St
- 43 Holman St
- 42 Emory St
- 34 Emory St
- 34 Holman St
Your Personal Tour Guide
Ask me questions while you tour the home.