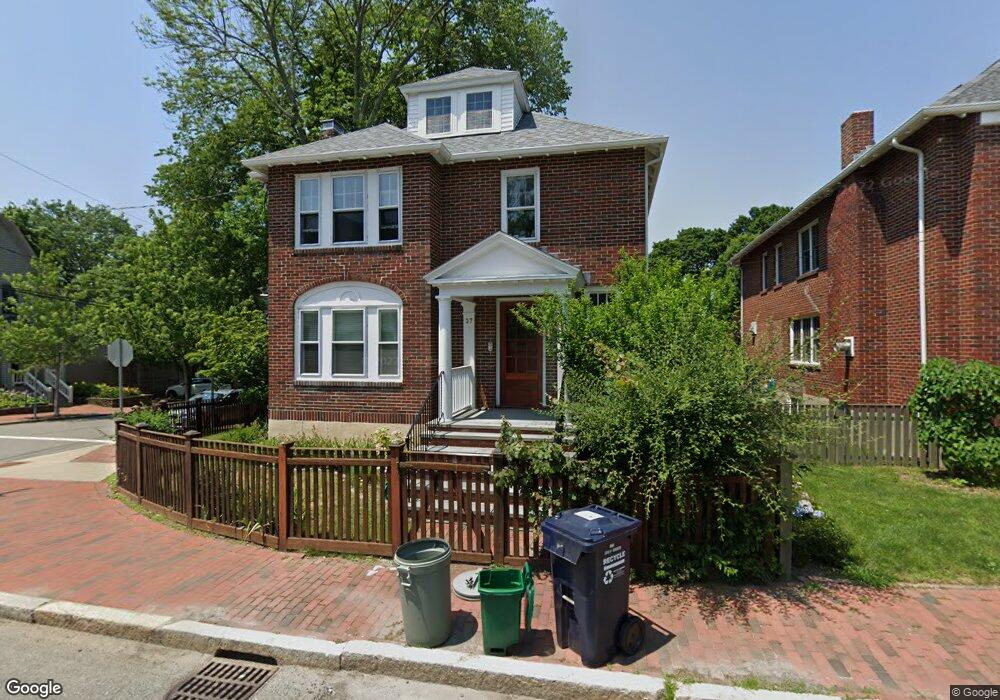
37 Huron Ave Unit 1 Cambridge, MA 02138
Neighborhood Nine NeighborhoodEstimated Value: $964,000 - $1,145,000
2
Beds
1
Bath
1,034
Sq Ft
$995/Sq Ft
Est. Value
About This Home
This home is located at 37 Huron Ave Unit 1, Cambridge, MA 02138 and is currently estimated at $1,029,227, approximately $995 per square foot. 37 Huron Ave Unit 1 is a home located in Middlesex County with nearby schools including Benjamin Banneker Charter Public School, Cambridge Montessori School, and St Peter School.
Ownership History
Date
Name
Owned For
Owner Type
Purchase Details
Closed on
May 22, 2006
Sold by
Sheehan Kathleen K
Bought by
Tomioka Katsuya and Lieu Tina T
Current Estimated Value
Home Financials for this Owner
Home Financials are based on the most recent Mortgage that was taken out on this home.
Original Mortgage
$417,000
Outstanding Balance
$241,785
Interest Rate
6.42%
Mortgage Type
Purchase Money Mortgage
Estimated Equity
$787,442
Purchase Details
Closed on
Aug 23, 2001
Sold by
Pratt Douglas and Catlin Ina
Bought by
Sheehan Kathleen K
Home Financials for this Owner
Home Financials are based on the most recent Mortgage that was taken out on this home.
Original Mortgage
$328,500
Interest Rate
7.21%
Mortgage Type
Purchase Money Mortgage
Create a Home Valuation Report for This Property
The Home Valuation Report is an in-depth analysis detailing your home's value as well as a comparison with similar homes in the area
Home Values in the Area
Average Home Value in this Area
Purchase History
| Date | Buyer | Sale Price | Title Company |
|---|---|---|---|
| Tomioka Katsuya | $530,000 | -- | |
| Sheehan Kathleen K | $365,000 | -- |
Source: Public Records
Mortgage History
| Date | Status | Borrower | Loan Amount |
|---|---|---|---|
| Open | Sheehan Kathleen K | $191,000 | |
| Open | Tomioka Katsuya | $417,000 | |
| Previous Owner | Sheehan Kathleen K | $328,500 |
Source: Public Records
Tax History
| Year | Tax Paid | Tax Assessment Tax Assessment Total Assessment is a certain percentage of the fair market value that is determined by local assessors to be the total taxable value of land and additions on the property. | Land | Improvement |
|---|---|---|---|---|
| 2025 | $6,213 | $978,500 | $0 | $978,500 |
| 2024 | $5,783 | $976,900 | $0 | $976,900 |
| 2023 | $5,501 | $938,800 | $0 | $938,800 |
| 2022 | $5,531 | $934,300 | $0 | $934,300 |
| 2021 | $5,339 | $912,700 | $0 | $912,700 |
| 2020 | $4,813 | $837,100 | $0 | $837,100 |
| 2019 | $4,623 | $778,200 | $0 | $778,200 |
| 2018 | $4,504 | $716,000 | $0 | $716,000 |
| 2017 | $4,357 | $671,400 | $0 | $671,400 |
| 2016 | $4,264 | $610,000 | $0 | $610,000 |
| 2015 | $4,227 | $540,600 | $0 | $540,600 |
| 2014 | $4,182 | $499,100 | $0 | $499,100 |
Source: Public Records
Map
Nearby Homes
- 12 Gray Gardens W Unit 14
- 84 Garden St
- 140 Huron Ave
- 43 Linnaean St Unit 1
- 281 Concord Ave
- 40 Mount Pleasant St Unit 4
- 204 Garden St
- 178 Richdale Ave
- 6 Washington Ave Unit 11
- 32 Copley St Unit 2
- 318 Concord Ave Unit 1
- 318 Concord Ave Unit 2
- 41 Bowdoin St Unit 33
- 24 Cambridge Terrace Unit 2
- 14-16 Field St
- 11 Wright St Unit 1
- 44 Garden St
- 2 Avon St Unit 6
- 46 Mount Vernon St Unit 1
- 22 Concord Ave Unit 11
- 37 Huron Ave Unit 2
- 33 Huron Ave
- 272 Upland Rd
- 29 Huron Ave Unit 31
- 283 Upland Rd Unit 3
- 283 Upland Rd Unit 2
- 283 Upland Rd Unit 1
- 283 Upland Rd Unit A
- 283 Upland Rd Unit 3,283
- 36 Huron Ave Unit 40
- 25 Huron Ave
- 42 Huron Ave
- 42 Huron Ave
- 42 Huron Ave Unit 1
- 273 Upland Rd
- 8 Newell Terrace
- 46 Huron Ave Unit 2
- 268 Upland Rd
- 28 Huron Ave
- 28 Huron Ave Unit 28
Your Personal Tour Guide
Ask me questions while you tour the home.