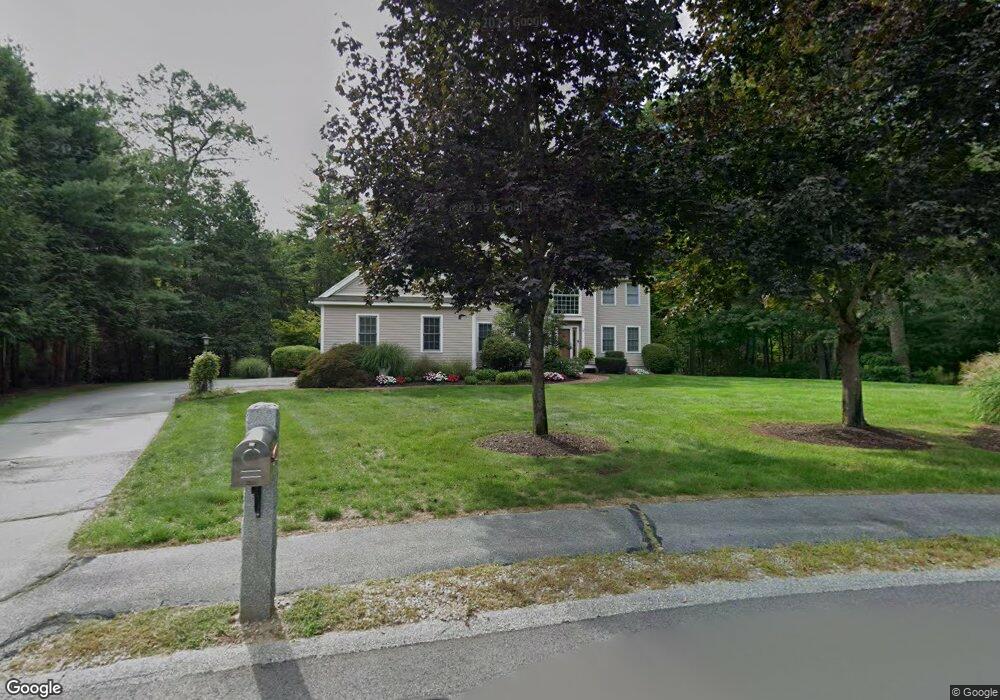
37 Jambard Rd Hollis, NH 03049
Hollis NeighborhoodEstimated Value: $889,571 - $1,088,000
4
Beds
3
Baths
2,712
Sq Ft
$364/Sq Ft
Est. Value
About This Home
This home is located at 37 Jambard Rd, Hollis, NH 03049 and is currently estimated at $986,893, approximately $363 per square foot. 37 Jambard Rd is a home with nearby schools including Hollis Primary School, Hollis Upper Elementary School, and Hollis-Brookline Middle School.
Ownership History
Date
Name
Owned For
Owner Type
Purchase Details
Closed on
Apr 11, 2005
Sold by
Monahan Michael P
Bought by
Mayer Rudiger J
Current Estimated Value
Home Financials for this Owner
Home Financials are based on the most recent Mortgage that was taken out on this home.
Original Mortgage
$460,000
Outstanding Balance
$236,145
Interest Rate
5.7%
Mortgage Type
Purchase Money Mortgage
Estimated Equity
$750,748
Purchase Details
Closed on
Aug 1, 2003
Sold by
Schulmann Florence M
Bought by
Monahan Michael P
Home Financials for this Owner
Home Financials are based on the most recent Mortgage that was taken out on this home.
Original Mortgage
$424,000
Interest Rate
5.28%
Purchase Details
Closed on
Mar 27, 1996
Sold by
Raisanen Homes Inc
Bought by
Kuchta Thomas A
Home Financials for this Owner
Home Financials are based on the most recent Mortgage that was taken out on this home.
Original Mortgage
$207,000
Interest Rate
6.9%
Create a Home Valuation Report for This Property
The Home Valuation Report is an in-depth analysis detailing your home's value as well as a comparison with similar homes in the area
Home Values in the Area
Average Home Value in this Area
Purchase History
| Date | Buyer | Sale Price | Title Company |
|---|---|---|---|
| Mayer Rudiger J | $575,000 | -- | |
| Monahan Michael P | $530,000 | -- | |
| Kuchta Thomas A | $265,700 | -- |
Source: Public Records
Mortgage History
| Date | Status | Borrower | Loan Amount |
|---|---|---|---|
| Open | Kuchta Thomas A | $115,000 | |
| Open | Kuchta Thomas A | $460,000 | |
| Previous Owner | Kuchta Thomas A | $424,000 | |
| Previous Owner | Kuchta Thomas A | $207,000 |
Source: Public Records
Tax History Compared to Growth
Tax History
| Year | Tax Paid | Tax Assessment Tax Assessment Total Assessment is a certain percentage of the fair market value that is determined by local assessors to be the total taxable value of land and additions on the property. | Land | Improvement |
|---|---|---|---|---|
| 2024 | $13,028 | $734,800 | $293,300 | $441,500 |
| 2023 | $12,242 | $734,800 | $293,300 | $441,500 |
| 2022 | $16,584 | $734,800 | $293,300 | $441,500 |
| 2021 | $10,653 | $469,300 | $188,300 | $281,000 |
| 2020 | $10,878 | $469,300 | $188,300 | $281,000 |
| 2019 | $10,841 | $469,300 | $188,300 | $281,000 |
| 2018 | $10,170 | $469,300 | $188,300 | $281,000 |
| 2017 | $9,820 | $424,200 | $163,000 | $261,200 |
| 2016 | $9,939 | $424,200 | $163,000 | $261,200 |
| 2015 | $9,765 | $424,200 | $163,000 | $261,200 |
| 2014 | $9,812 | $424,200 | $163,000 | $261,200 |
| 2013 | $9,680 | $424,200 | $163,000 | $261,200 |
Source: Public Records
Map
Nearby Homes