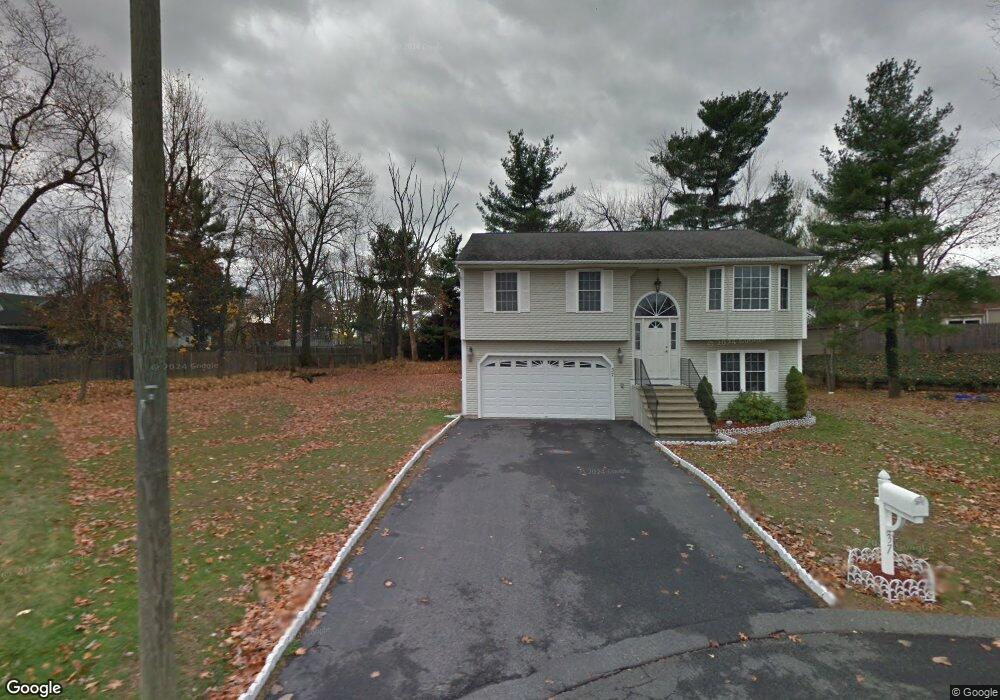
37 Jimmy Ct Springfield, MA 01104
East Springfield NeighborhoodEstimated Value: $224,000 - $365,099
3
Beds
3
Baths
1,131
Sq Ft
$287/Sq Ft
Est. Value
About This Home
This home is located at 37 Jimmy Ct, Springfield, MA 01104 and is currently estimated at $325,025, approximately $287 per square foot. 37 Jimmy Ct is a home located in Hampden County with nearby schools including Daniel B Brunton, John F. Kennedy Academy, and Springfield Central High School.
Ownership History
Date
Name
Owned For
Owner Type
Purchase Details
Closed on
Jul 16, 2012
Sold by
Rivera Michael and Dejesus Evelyn J
Bought by
Rivera Michael
Current Estimated Value
Purchase Details
Closed on
Sep 2, 2005
Sold by
Source 9 Dev Llc and Pafumi James A
Bought by
Rivera Evelyn J and Rivera Michael
Home Financials for this Owner
Home Financials are based on the most recent Mortgage that was taken out on this home.
Original Mortgage
$218,500
Interest Rate
5.81%
Mortgage Type
Purchase Money Mortgage
Create a Home Valuation Report for This Property
The Home Valuation Report is an in-depth analysis detailing your home's value as well as a comparison with similar homes in the area
Home Values in the Area
Average Home Value in this Area
Purchase History
| Date | Buyer | Sale Price | Title Company |
|---|---|---|---|
| Rivera Michael | -- | -- | |
| Rivera Evelyn J | $230,000 | -- |
Source: Public Records
Mortgage History
| Date | Status | Borrower | Loan Amount |
|---|---|---|---|
| Previous Owner | Rivera Evelyn J | $218,500 |
Source: Public Records
Tax History
| Year | Tax Paid | Tax Assessment Tax Assessment Total Assessment is a certain percentage of the fair market value that is determined by local assessors to be the total taxable value of land and additions on the property. | Land | Improvement |
|---|---|---|---|---|
| 2025 | $5,036 | $321,200 | $40,600 | $280,600 |
| 2024 | $4,751 | $295,800 | $40,600 | $255,200 |
| 2023 | $4,513 | $264,700 | $37,900 | $226,800 |
| 2022 | $4,458 | $236,900 | $35,500 | $201,400 |
| 2021 | $4,343 | $229,800 | $32,200 | $197,600 |
| 2020 | $4,215 | $215,800 | $32,200 | $183,600 |
| 2019 | $3,936 | $200,000 | $33,200 | $166,800 |
| 2018 | $3,741 | $190,100 | $33,200 | $156,900 |
| 2017 | $3,555 | $180,800 | $30,100 | $150,700 |
| 2016 | $3,441 | $175,000 | $30,100 | $144,900 |
| 2015 | $3,427 | $174,200 | $30,100 | $144,100 |
Source: Public Records
Map
Nearby Homes
- 294 Tremont St
- 83 Oakdale St
- 93 Grochmal Ave Unit 12
- 19 Emily St
- 4 Seneca St
- 147 Bowles Park
- 66 Bromont St
- 108 Barre St
- 28 Mockingbird Dr
- 1289 Bay St
- 251 Edendale St
- 225 Osborne Terrace
- 181 Marsden St
- 58 Eureka St
- 543 Boston Rd
- 63 Peer St
- 270 Berkshire Ave
- 1730 Carew St
- 78 Massreco St
- 114 Monrovia St
Your Personal Tour Guide
Ask me questions while you tour the home.