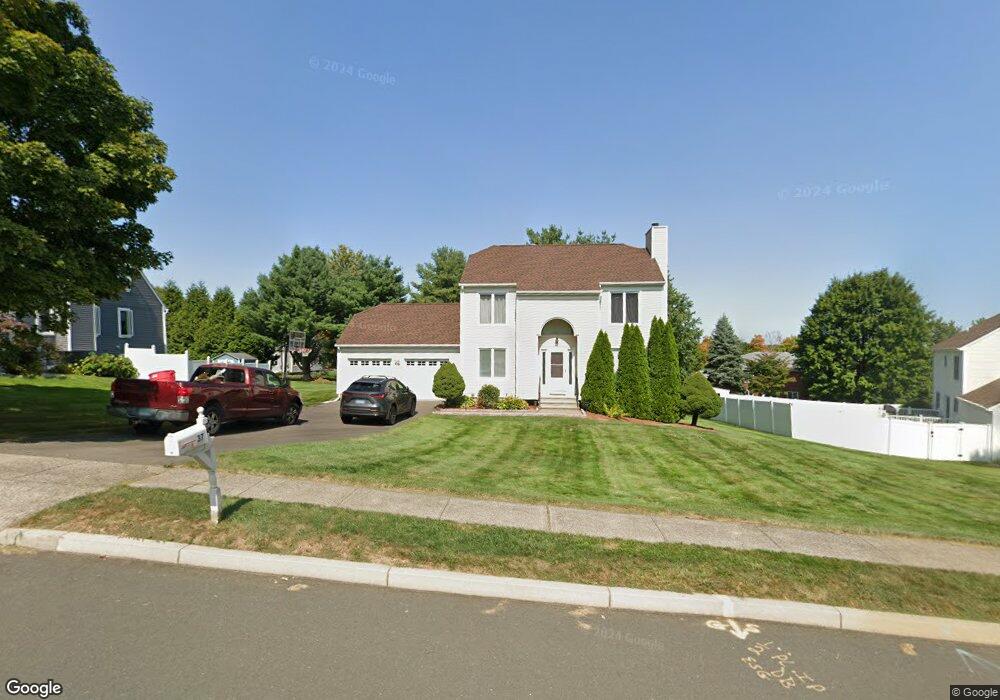
37 Ledgebrook Ln Middletown, CT 06457
Westfield NeighborhoodEstimated Value: $401,000 - $440,000
3
Beds
2
Baths
1,562
Sq Ft
$271/Sq Ft
Est. Value
About This Home
This home is located at 37 Ledgebrook Ln, Middletown, CT 06457 and is currently estimated at $423,130, approximately $270 per square foot. 37 Ledgebrook Ln is a home located in Middlesex County with nearby schools including Spencer School, Middletown High School, and St John Paul II School.
Ownership History
Date
Name
Owned For
Owner Type
Purchase Details
Closed on
Oct 4, 2010
Sold by
Vincent Diana Vincent and Vincent Diana
Bought by
Chhillar Pushpender and Mahajan Shivani
Current Estimated Value
Home Financials for this Owner
Home Financials are based on the most recent Mortgage that was taken out on this home.
Original Mortgage
$266,412
Outstanding Balance
$175,294
Interest Rate
4.37%
Mortgage Type
FHA
Estimated Equity
$247,836
Purchase Details
Closed on
Jan 16, 2004
Sold by
Cardi Deborah A and Cardi Michael J
Bought by
Diana Vincent
Home Financials for this Owner
Home Financials are based on the most recent Mortgage that was taken out on this home.
Original Mortgage
$175,000
Interest Rate
5.98%
Purchase Details
Closed on
Dec 22, 1992
Sold by
Cabrera Jorge L and Cabrera Maria T
Bought by
Cardi Michaelj and Cardi Deborah A
Purchase Details
Closed on
Aug 8, 1989
Sold by
Woodbridge Devel
Bought by
Cabrera Jorge L
Create a Home Valuation Report for This Property
The Home Valuation Report is an in-depth analysis detailing your home's value as well as a comparison with similar homes in the area
Home Values in the Area
Average Home Value in this Area
Purchase History
| Date | Buyer | Sale Price | Title Company |
|---|---|---|---|
| Chhillar Pushpender | $270,000 | -- | |
| Diana Vincent | $265,000 | -- | |
| Cardi Michaelj | $158,500 | -- | |
| Cabrera Jorge L | $174,900 | -- | |
| Chhillar Pushpender | $270,000 | -- | |
| Diana Vincent | $265,000 | -- |
Source: Public Records
Mortgage History
| Date | Status | Borrower | Loan Amount |
|---|---|---|---|
| Open | Cabrera Jorge L | $266,412 | |
| Closed | Cabrera Jorge L | $266,412 | |
| Previous Owner | Cabrera Jorge L | $175,000 |
Source: Public Records
Tax History
| Year | Tax Paid | Tax Assessment Tax Assessment Total Assessment is a certain percentage of the fair market value that is determined by local assessors to be the total taxable value of land and additions on the property. | Land | Improvement |
|---|---|---|---|---|
| 2025 | $9,022 | $231,940 | $75,390 | $156,550 |
| 2024 | $8,535 | $231,940 | $75,390 | $156,550 |
| 2023 | $8,141 | $231,940 | $75,390 | $156,550 |
| 2022 | $7,013 | $159,380 | $50,260 | $109,120 |
| 2021 | $7,013 | $159,380 | $50,260 | $109,120 |
| 2020 | $7,045 | $159,380 | $50,260 | $109,120 |
| 2019 | $7,076 | $159,380 | $50,260 | $109,120 |
| 2018 | $6,965 | $159,380 | $50,260 | $109,120 |
| 2017 | $6,988 | $164,820 | $55,650 | $109,170 |
| 2016 | $6,791 | $164,820 | $55,650 | $109,170 |
| 2015 | $6,527 | $164,820 | $55,650 | $109,170 |
| 2014 | $6,593 | $164,820 | $55,650 | $109,170 |
Source: Public Records
Map
Nearby Homes
- 161 Cynthia Ln Unit E5
- 163 Cynthia Ln Unit A4
- 94 Cynthia Ln Unit D-5
- 565 Newfield St Unit 34
- 5 Nathan Hale Rd
- 3 Nathan Hale Rd
- 4 Nathan Hale Rd
- 1 Nathan Hale Rd
- 2 Nathan Hale Rd
- 82 Westfield Terrace
- 30 Hemlock Place
- 168 Lisa Ln
- 581 High St
- 565 High St
- 137 Webster Ln Unit 2-42
- 145 Webster Ln Unit 2-41
- 103 Grove St
- 123 Webster Ln
- 105 Spring St
- 27 Barbara Rd
- 45 Ledgebrook Ln
- 23 Ledgebrook Ln
- 61 Spring Brook Dr
- 75 Spring Brook Dr
- 48 Ledgebrook Ln
- 53 Spring Brook Dr
- 53 Ledgebrook Ln
- 38 Ledgebrook Ln
- 56 Ledgebrook Ln
- 30 Ledgebrook Ln
- 14 Ledgebrook Ln
- 43 Spring Brook Dr
- 22 Ledgebrook Ln
- 58 Spring Brook Dr
- 93 Spring Brook Dr
- 46 Spring Brook Dr
- 63 Ledgebrook Ln
- 70 Spring Brook Dr
- 52 Brookview Ln
- 50 Brookview Ln
Your Personal Tour Guide
Ask me questions while you tour the home.