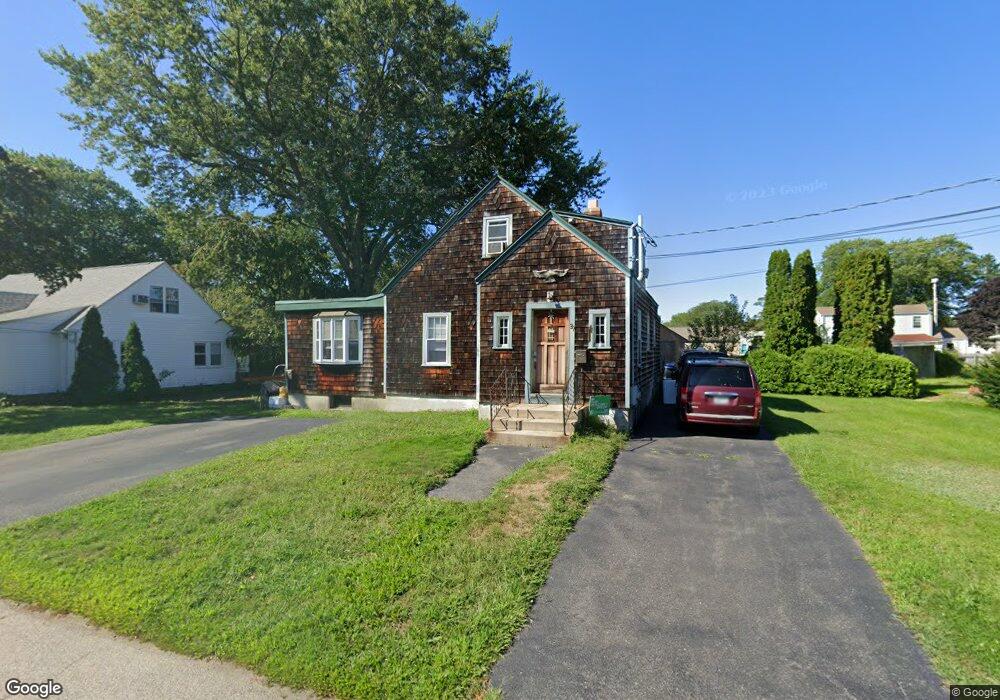
37 Lindy Ave Riverside, RI 02915
Riverside NeighborhoodEstimated Value: $469,813 - $543,000
3
Beds
2
Baths
2,039
Sq Ft
$255/Sq Ft
Est. Value
About This Home
This home is located at 37 Lindy Ave, Riverside, RI 02915 and is currently estimated at $519,453, approximately $254 per square foot. 37 Lindy Ave is a home located in Providence County with nearby schools including East Providence High School, St Luke Elementary School, and Barrington Christian Academy.
Ownership History
Date
Name
Owned For
Owner Type
Purchase Details
Closed on
Oct 17, 2013
Sold by
Murray Michael J
Bought by
Murray Kristine M
Current Estimated Value
Home Financials for this Owner
Home Financials are based on the most recent Mortgage that was taken out on this home.
Original Mortgage
$138,000
Outstanding Balance
$34,278
Interest Rate
4.34%
Estimated Equity
$485,175
Purchase Details
Closed on
Jun 2, 1994
Sold by
Miller George A and Miller Dorothy
Bought by
Racca Kristine M
Create a Home Valuation Report for This Property
The Home Valuation Report is an in-depth analysis detailing your home's value as well as a comparison with similar homes in the area
Home Values in the Area
Average Home Value in this Area
Purchase History
| Date | Buyer | Sale Price | Title Company |
|---|---|---|---|
| Murray Kristine M | -- | -- | |
| Racca Kristine M | $110,000 | -- |
Source: Public Records
Mortgage History
| Date | Status | Borrower | Loan Amount |
|---|---|---|---|
| Open | Racca Kristine M | $138,000 | |
| Previous Owner | Racca Kristine M | $80,000 | |
| Previous Owner | Racca Kristine M | $65,000 |
Source: Public Records
Tax History
| Year | Tax Paid | Tax Assessment Tax Assessment Total Assessment is a certain percentage of the fair market value that is determined by local assessors to be the total taxable value of land and additions on the property. | Land | Improvement |
|---|---|---|---|---|
| 2025 | $5,624 | $430,300 | $139,000 | $291,300 |
| 2024 | $5,778 | $376,900 | $115,800 | $261,100 |
| 2023 | $5,563 | $376,900 | $115,800 | $261,100 |
| 2022 | $5,082 | $232,500 | $59,900 | $172,600 |
| 2021 | $4,999 | $232,500 | $59,100 | $173,400 |
| 2020 | $4,787 | $232,500 | $59,100 | $173,400 |
| 2019 | $4,655 | $232,500 | $59,100 | $173,400 |
| 2018 | $4,867 | $212,700 | $57,600 | $155,100 |
| 2017 | $4,758 | $212,700 | $57,600 | $155,100 |
| 2016 | $4,735 | $212,700 | $57,600 | $155,100 |
| 2015 | $4,172 | $181,800 | $53,300 | $128,500 |
| 2014 | $4,172 | $181,800 | $53,300 | $128,500 |
Source: Public Records
Map
Nearby Homes
- 14 Winthrop St
- 14 Benedict St
- 15 Claire St
- 85 Hilton Ave
- 103 Burnside Ave
- 23 Albert Ave
- 41 White Ave
- 56 Knowlton St
- 25 Arnold St
- 33 Pine St Unit 35
- 0 Carousel Dr
- 45 Washington Rd
- 151 Willett Ave Unit 2
- 28 Jefferson Ave
- 6 Hazelton Rd
- 85 Hospital Rd
- 916 Bullocks Pt Ave
- 9 Mystic Ave
- 65 Estrell Dr
- 43 Bullocks Point Ave Unit 4A
Your Personal Tour Guide
Ask me questions while you tour the home.