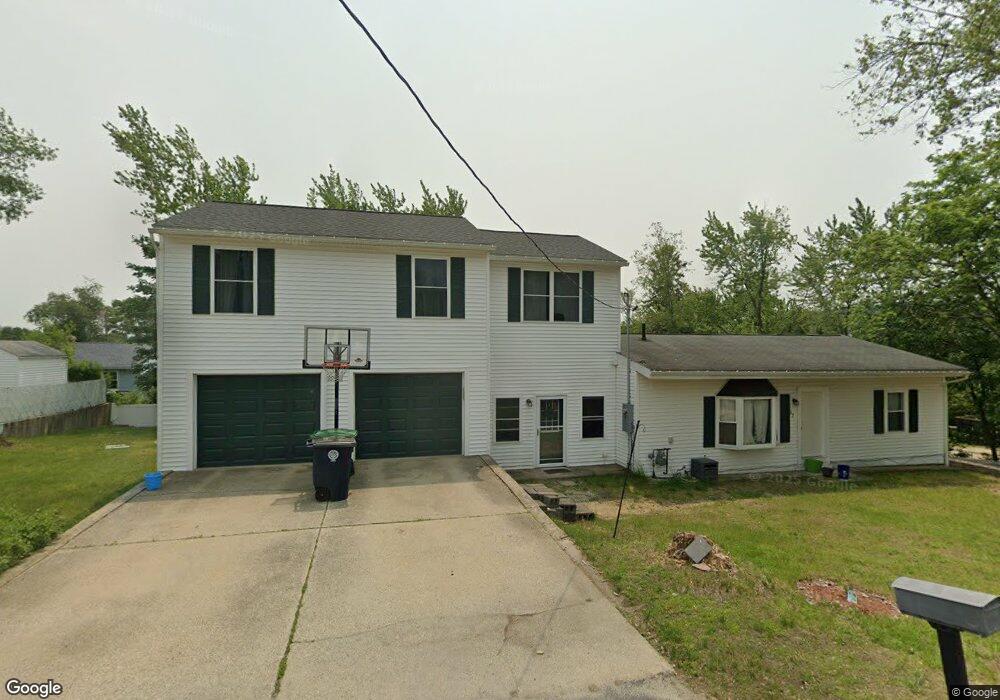
37 Linton St Unit 199200 Nashua, NH 03060
Southeast Nashua NeighborhoodEstimated Value: $529,000 - $593,000
5
Beds
2
Baths
2,264
Sq Ft
$246/Sq Ft
Est. Value
About This Home
This home is located at 37 Linton St Unit 199200, Nashua, NH 03060 and is currently estimated at $556,654, approximately $245 per square foot. 37 Linton St Unit 199200 is a home located in Hillsborough County with nearby schools including Sunset Heights Elementary School, Elm Street Middle School, and Nashua High School South.
Ownership History
Date
Name
Owned For
Owner Type
Purchase Details
Closed on
Jul 3, 2006
Sold by
Drouin G Martha
Bought by
Feldpausch Isaac L
Current Estimated Value
Home Financials for this Owner
Home Financials are based on the most recent Mortgage that was taken out on this home.
Original Mortgage
$233,816
Interest Rate
6.58%
Mortgage Type
Purchase Money Mortgage
Create a Home Valuation Report for This Property
The Home Valuation Report is an in-depth analysis detailing your home's value as well as a comparison with similar homes in the area
Home Values in the Area
Average Home Value in this Area
Purchase History
| Date | Buyer | Sale Price | Title Company |
|---|---|---|---|
| Feldpausch Isaac L | $232,000 | -- |
Source: Public Records
Mortgage History
| Date | Status | Borrower | Loan Amount |
|---|---|---|---|
| Open | Feldpausch Isaac L | $201,400 | |
| Closed | Feldpausch Isaac L | $233,816 |
Source: Public Records
Tax History
| Year | Tax Paid | Tax Assessment Tax Assessment Total Assessment is a certain percentage of the fair market value that is determined by local assessors to be the total taxable value of land and additions on the property. | Land | Improvement |
|---|---|---|---|---|
| 2025 | $8,871 | $527,100 | $154,900 | $372,200 |
| 2024 | $8,381 | $527,100 | $154,900 | $372,200 |
| 2023 | $7,965 | $436,900 | $123,900 | $313,000 |
| 2022 | $7,895 | $436,900 | $123,900 | $313,000 |
| 2021 | $5,635 | $242,700 | $86,800 | $155,900 |
| 2020 | $5,515 | $243,900 | $86,800 | $157,100 |
| 2019 | $4,963 | $228,100 | $86,800 | $141,300 |
| 2018 | $4,838 | $228,100 | $86,800 | $141,300 |
| 2017 | $4,018 | $155,800 | $74,900 | $80,900 |
| 2016 | $3,906 | $155,800 | $74,900 | $80,900 |
| 2015 | $3,822 | $155,800 | $74,900 | $80,900 |
| 2014 | $3,747 | $155,800 | $74,900 | $80,900 |
Source: Public Records
Map
Nearby Homes
- 1 E Hobart St
- 51 Farmington Rd
- 160 Daniel Webster Hwy Unit 319
- 1 Thompson Rd Unit 109
- 6 Mountain View St
- 397 S Main St
- 23 Eastman St
- 31 Bluestone Dr
- 6 Hayden St
- 21 Clearview Dr
- 8 Collier Ct
- 25 E Dunstable Rd
- 5 Louisburg Square Unit 11
- 3 Louisburg Square Unit 1
- 31 Lincoln Ave
- 12 Oakdale Ave
- 362 Main St
- 16 Emerson Rd
- 14 Spruce St
- 11 Linden St
- 36 E Glenwood St Unit 186
- 44 E Glenwood St Unit 184
- 16 E Glenwood St
- 55 Linton St Unit 202
- 36 Linton St
- 40 Linton St
- 52 E Glenwood St Unit 182
- 45 E Glenwood St Unit 130
- 17 E Glenwood St Unit 128
- 58 Linton St Unit 252253
- 57 Linton St Unit 204
- 57 Linton St Unit 203
- 49 E Glenwood St
- 10 E Glenwood St
- 13 E Glenwood St
- 46 E Hobart St
- 48 E Hobart St
- 60 Linton St
- 57 E Glenwood St Unit 134
- 65 Linton St Unit 206
Your Personal Tour Guide
Ask me questions while you tour the home.