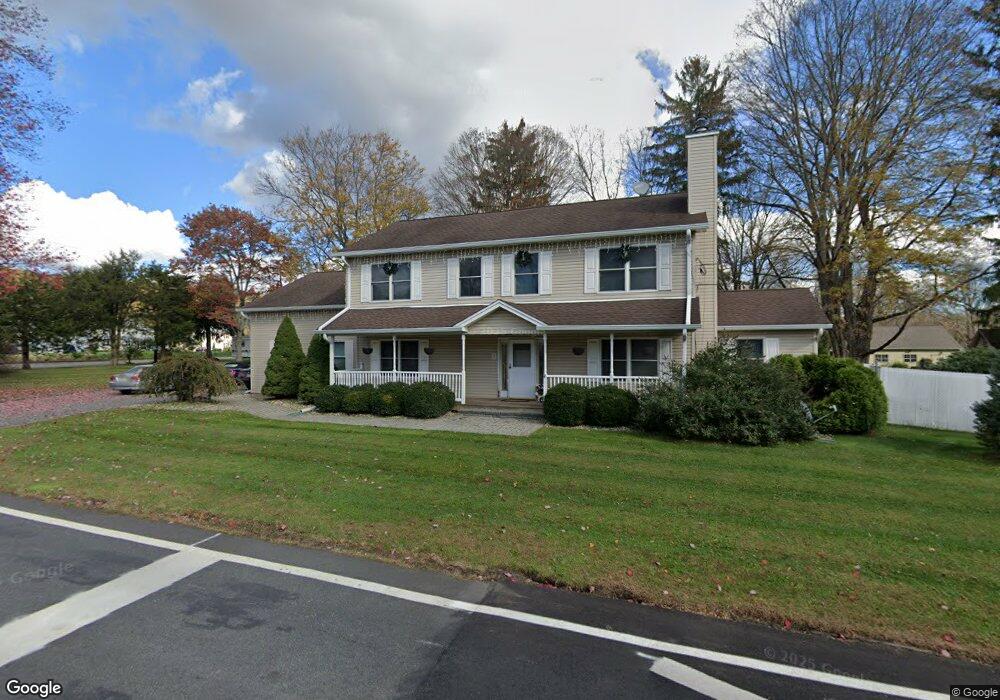
37 Main St Flanders, NJ 07836
Estimated Value: $596,000 - $791,000
--
Bed
--
Bath
2,922
Sq Ft
$251/Sq Ft
Est. Value
About This Home
This home is located at 37 Main St, Flanders, NJ 07836 and is currently estimated at $732,622, approximately $250 per square foot. 37 Main St is a home located in Morris County with nearby schools including Mt Olive Middle School, Mount Olive High School, and American Christian School.
Ownership History
Date
Name
Owned For
Owner Type
Purchase Details
Closed on
May 26, 2010
Sold by
Feilon William and Feilon Pamela
Bought by
Bassili Michael and Bassili Janice
Current Estimated Value
Home Financials for this Owner
Home Financials are based on the most recent Mortgage that was taken out on this home.
Original Mortgage
$330,548
Outstanding Balance
$213,566
Interest Rate
4.25%
Mortgage Type
FHA
Estimated Equity
$519,056
Purchase Details
Closed on
Aug 29, 2002
Sold by
Egri Group
Bought by
Maccario Anthony and Maccario Sandra
Home Financials for this Owner
Home Financials are based on the most recent Mortgage that was taken out on this home.
Original Mortgage
$144,000
Interest Rate
6.48%
Purchase Details
Closed on
Mar 26, 2002
Sold by
Arianna Holding
Bought by
Egri Group
Create a Home Valuation Report for This Property
The Home Valuation Report is an in-depth analysis detailing your home's value as well as a comparison with similar homes in the area
Home Values in the Area
Average Home Value in this Area
Purchase History
| Date | Buyer | Sale Price | Title Company |
|---|---|---|---|
| Bassili Michael | $335,000 | First American Title Ins Co | |
| Maccario Anthony | $180,000 | -- | |
| Egri Group | $75,500 | -- |
Source: Public Records
Mortgage History
| Date | Status | Borrower | Loan Amount |
|---|---|---|---|
| Open | Bassili Michael | $330,548 | |
| Previous Owner | Maccario Anthony | $144,000 |
Source: Public Records
Tax History Compared to Growth
Tax History
| Year | Tax Paid | Tax Assessment Tax Assessment Total Assessment is a certain percentage of the fair market value that is determined by local assessors to be the total taxable value of land and additions on the property. | Land | Improvement |
|---|---|---|---|---|
| 2025 | $14,058 | $403,400 | $136,000 | $267,400 |
| 2024 | $13,260 | $403,400 | $136,000 | $267,400 |
| 2023 | $13,260 | $403,400 | $136,000 | $267,400 |
| 2022 | $13,546 | $403,400 | $136,000 | $267,400 |
| 2021 | $13,546 | $403,400 | $136,000 | $267,400 |
| 2020 | $13,365 | $403,400 | $136,000 | $267,400 |
| 2019 | $13,320 | $403,400 | $136,000 | $267,400 |
| 2018 | $13,191 | $403,400 | $136,000 | $267,400 |
| 2017 | $12,961 | $403,400 | $136,000 | $267,400 |
| 2016 | $12,550 | $403,400 | $136,000 | $267,400 |
| 2015 | $12,844 | $403,400 | $136,000 | $267,400 |
| 2014 | $12,856 | $403,400 | $136,000 | $267,400 |
Source: Public Records
Map
Nearby Homes
- 19 Park Place
- 6 Mountain Ave
- 23 Hillside Ave
- 6 Ironia Rd
- 150 U S Highway 206
- 7 Virgil Ln
- 24 Ramar St
- 146 U S Highway 206
- 150 Clover Hill Dr
- 72 Flanders Drakestown Rd
- 6 Perin Place
- 32 Radcliffe Dr
- 11 Colonial Way
- 3 Makin Ln
- 138 Bartley Flanders Rd
- 1 Kenneth Terrace
- 39 Alden Terrace
- 15 Prides Crossing
- 4 Evelyn Terrace
- 5 Edor Ln