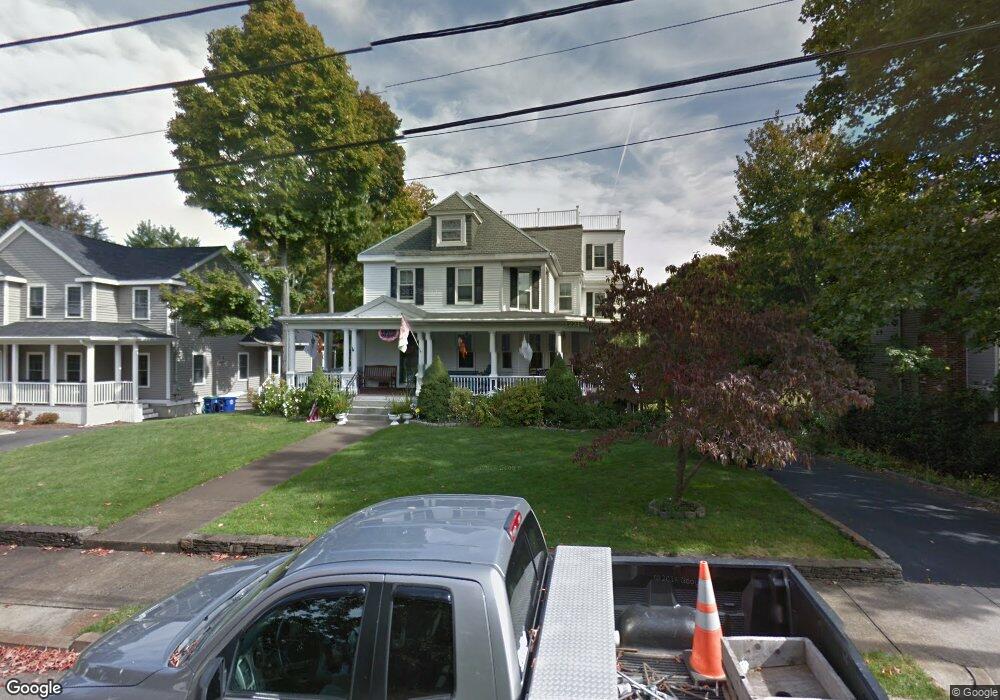
37 Maple St Braintree, MA 02184
North Braintree NeighborhoodEstimated Value: $1,231,000 - $1,438,000
5
Beds
4
Baths
4,138
Sq Ft
$325/Sq Ft
Est. Value
About This Home
This home is located at 37 Maple St, Braintree, MA 02184 and is currently estimated at $1,343,711, approximately $324 per square foot. 37 Maple St is a home located in Norfolk County with nearby schools including Braintree High School, Step Ahead Kindergarten, and Meeting House Montessori School.
Ownership History
Date
Name
Owned For
Owner Type
Purchase Details
Closed on
Apr 27, 2009
Sold by
Healy Seamus and Odonnell Eileen
Bought by
Healy Seamus
Current Estimated Value
Home Financials for this Owner
Home Financials are based on the most recent Mortgage that was taken out on this home.
Original Mortgage
$182,000
Outstanding Balance
$115,486
Interest Rate
4.93%
Mortgage Type
Purchase Money Mortgage
Estimated Equity
$1,228,225
Purchase Details
Closed on
Jan 25, 1996
Sold by
Handy Edward J and Handy Louise A
Bought by
Healy Seamus and Healy Eileen
Home Financials for this Owner
Home Financials are based on the most recent Mortgage that was taken out on this home.
Original Mortgage
$152,900
Interest Rate
7.13%
Mortgage Type
Purchase Money Mortgage
Create a Home Valuation Report for This Property
The Home Valuation Report is an in-depth analysis detailing your home's value as well as a comparison with similar homes in the area
Home Values in the Area
Average Home Value in this Area
Purchase History
| Date | Buyer | Sale Price | Title Company |
|---|---|---|---|
| Healy Seamus | -- | -- | |
| Healy Seamus | $255,000 | -- | |
| Healy Seamus | $255,000 | -- |
Source: Public Records
Mortgage History
| Date | Status | Borrower | Loan Amount |
|---|---|---|---|
| Open | Healy Seamus | $182,000 | |
| Previous Owner | Healy Seamus | $152,900 |
Source: Public Records
Tax History
| Year | Tax Paid | Tax Assessment Tax Assessment Total Assessment is a certain percentage of the fair market value that is determined by local assessors to be the total taxable value of land and additions on the property. | Land | Improvement |
|---|---|---|---|---|
| 2025 | $10,913 | $1,093,500 | $409,000 | $684,500 |
| 2024 | $10,048 | $1,059,900 | $383,400 | $676,500 |
| 2023 | $9,624 | $986,100 | $347,600 | $638,500 |
| 2022 | $9,405 | $945,200 | $306,700 | $638,500 |
| 2021 | $9,028 | $907,300 | $306,700 | $600,600 |
| 2020 | $8,321 | $843,900 | $269,900 | $574,000 |
| 2019 | $8,173 | $810,000 | $269,900 | $540,100 |
| 2018 | $7,824 | $742,300 | $224,900 | $517,400 |
| 2017 | $7,646 | $711,900 | $224,900 | $487,000 |
| 2016 | $7,358 | $670,100 | $204,500 | $465,600 |
| 2015 | $7,194 | $649,900 | $201,400 | $448,500 |
| 2014 | $6,821 | $597,300 | $183,000 | $414,300 |
Source: Public Records
Map
Nearby Homes
- 491 Washington St Unit 1
- 6 Oak St
- 5 Woodsum Dr Unit 12
- 30 Church St Unit 4
- 20 Vine St
- 63 Dickerman Ln
- 50 Cleveland Ave
- 29 Joseph Rd
- 36 Chestnut Ave
- 255 River St
- 342 Elm St
- 17 White Rd
- 9 Independence Ave Unit 307
- 15 Calvin St
- 7 Del's Way
- 6 Franklin St
- 18 Royal Lake Dr Unit 3
- 20 Blossom Rd
- 47 Addison St
- 31 Doris Rd
Your Personal Tour Guide
Ask me questions while you tour the home.