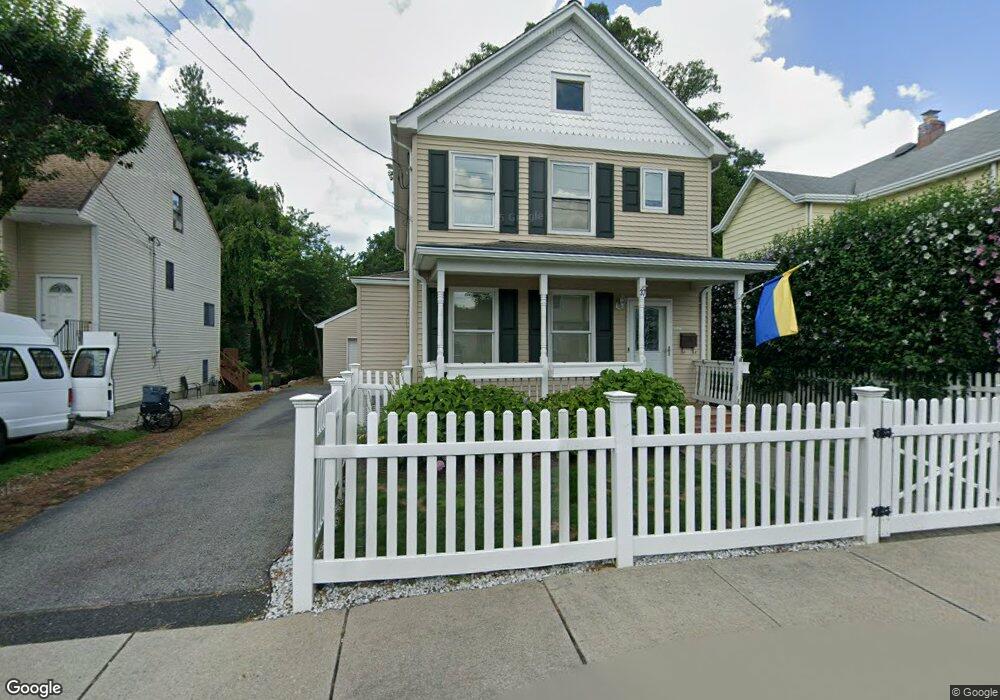
37 New St Ramsey, NJ 07446
Estimated Value: $643,000 - $763,000
Studio
--
Bath
1,548
Sq Ft
$445/Sq Ft
Est. Value
About This Home
This home is located at 37 New St, Ramsey, NJ 07446 and is currently estimated at $688,397, approximately $444 per square foot. 37 New St is a home located in Bergen County with nearby schools including Ramsey High School and Young World Day School.
Ownership History
Date
Name
Owned For
Owner Type
Purchase Details
Closed on
Jul 15, 1998
Sold by
Stewen Bernard H and Baruffaldi Todd R
Bought by
Cantisano Richard
Current Estimated Value
Home Financials for this Owner
Home Financials are based on the most recent Mortgage that was taken out on this home.
Original Mortgage
$196,000
Outstanding Balance
$40,075
Interest Rate
6.99%
Estimated Equity
$648,322
Purchase Details
Closed on
Dec 10, 1997
Sold by
Thompson Elaine E and Thompson Edna G
Bought by
Baruffaldi Todd R and Stewen Bernard H
Create a Home Valuation Report for This Property
The Home Valuation Report is an in-depth analysis detailing your home's value as well as a comparison with similar homes in the area
Home Values in the Area
Average Home Value in this Area
Purchase History
| Date | Buyer | Sale Price | Title Company |
|---|---|---|---|
| Cantisano Richard | $245,000 | -- | |
| Baruffaldi Todd R | $140,000 | -- |
Source: Public Records
Mortgage History
| Date | Status | Borrower | Loan Amount |
|---|---|---|---|
| Open | Cantisano Richard | $196,000 |
Source: Public Records
Tax History
| Year | Tax Paid | Tax Assessment Tax Assessment Total Assessment is a certain percentage of the fair market value that is determined by local assessors to be the total taxable value of land and additions on the property. | Land | Improvement |
|---|---|---|---|---|
| 2025 | $12,648 | $594,600 | $317,300 | $277,300 |
| 2024 | $12,267 | $448,200 | $258,600 | $189,600 |
| 2023 | $11,756 | $448,200 | $258,600 | $189,600 |
| 2022 | $11,756 | $448,200 | $258,600 | $189,600 |
| 2021 | $11,017 | $448,200 | $258,600 | $189,600 |
| 2020 | $11,519 | $448,200 | $258,600 | $189,600 |
| 2019 | $10,855 | $441,600 | $258,600 | $183,000 |
| 2018 | $10,585 | $441,600 | $258,600 | $183,000 |
| 2017 | $10,386 | $441,600 | $258,600 | $183,000 |
| 2016 | $10,099 | $441,600 | $258,600 | $183,000 |
| 2015 | $8,449 | $312,800 | $190,400 | $122,400 |
| 2014 | $8,305 | $312,800 | $190,400 | $122,400 |
Source: Public Records
Map
Nearby Homes
- 92 W Main St
- 96 W Main St
- 98 W Main St
- 46 Cherry Ln
- 44 N Central Ave
- 28 North St
- 89 Church St
- 122 Orchard Place
- 199 Darlington Ave
- 5306 Christopher St
- 903 Washington Dr
- 210 Washington Dr
- 41 Ramsey Ave
- 61 Beech St
- 141 W Oak St
- 121 Regency Park
- 15 Old Oak Dr
- 75 Cherokee Ave
- 19 Crescent Hollow Ct
- 2309 Hemingway Ln
Your Personal Tour Guide
Ask me questions while you tour the home.