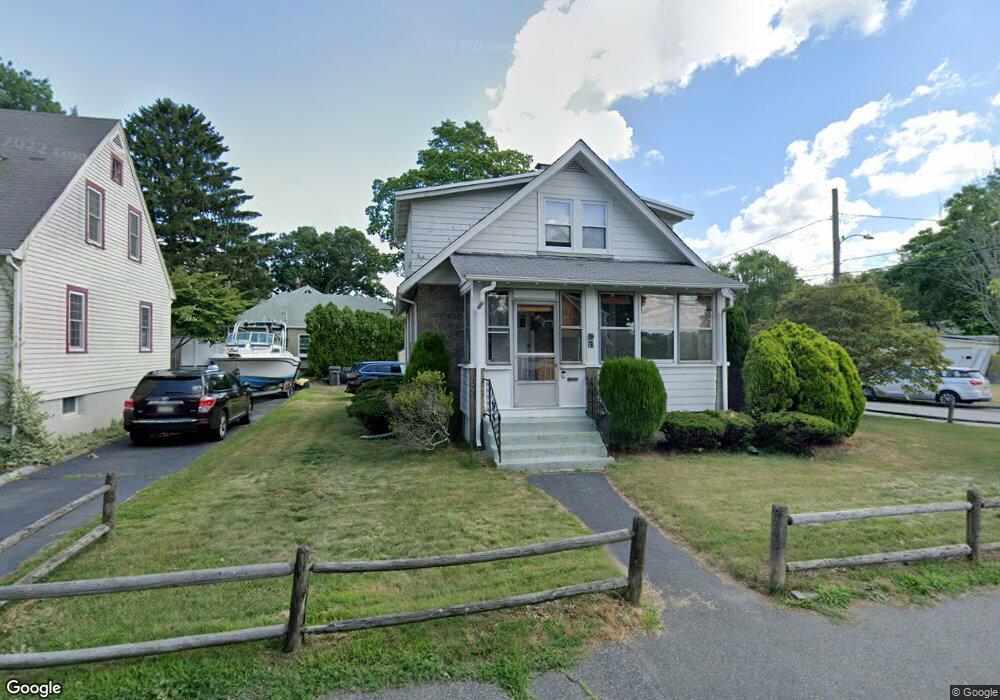
37 Nipmuc Rd Framingham, MA 01702
Estimated Value: $436,000 - $566,000
3
Beds
1
Bath
1,152
Sq Ft
$419/Sq Ft
Est. Value
About This Home
This home is located at 37 Nipmuc Rd, Framingham, MA 01702 and is currently estimated at $483,196, approximately $419 per square foot. 37 Nipmuc Rd is a home located in Middlesex County with nearby schools including Framingham High School, Happy Hollow School, and Pincushion Hill Montessori School.
Ownership History
Date
Name
Owned For
Owner Type
Purchase Details
Closed on
Jul 30, 1993
Sold by
Fallon Kristyne L
Bought by
Wong John S and Yee Mei Y
Current Estimated Value
Home Financials for this Owner
Home Financials are based on the most recent Mortgage that was taken out on this home.
Original Mortgage
$111,600
Interest Rate
7.32%
Mortgage Type
Purchase Money Mortgage
Purchase Details
Closed on
Aug 27, 1991
Sold by
Est Gray Margaret B
Bought by
Fallon Kristyne L
Home Financials for this Owner
Home Financials are based on the most recent Mortgage that was taken out on this home.
Original Mortgage
$95,000
Interest Rate
9.55%
Mortgage Type
Purchase Money Mortgage
Create a Home Valuation Report for This Property
The Home Valuation Report is an in-depth analysis detailing your home's value as well as a comparison with similar homes in the area
Home Values in the Area
Average Home Value in this Area
Purchase History
| Date | Buyer | Sale Price | Title Company |
|---|---|---|---|
| Wong John S | $124,000 | -- | |
| Wong John S | $124,000 | -- | |
| Fallon Kristyne L | $122,500 | -- | |
| Fallon Kristyne L | $122,500 | -- |
Source: Public Records
Mortgage History
| Date | Status | Borrower | Loan Amount |
|---|---|---|---|
| Open | Fallon Kristyne L | $30,000 | |
| Closed | Fallon Kristyne L | $111,600 | |
| Previous Owner | Fallon Kristyne L | $95,000 |
Source: Public Records
Tax History Compared to Growth
Tax History
| Year | Tax Paid | Tax Assessment Tax Assessment Total Assessment is a certain percentage of the fair market value that is determined by local assessors to be the total taxable value of land and additions on the property. | Land | Improvement |
|---|---|---|---|---|
| 2025 | $4,712 | $394,600 | $200,500 | $194,100 |
| 2024 | $4,695 | $376,800 | $178,300 | $198,500 |
| 2023 | $4,438 | $339,000 | $159,300 | $179,700 |
| 2022 | $4,160 | $302,800 | $144,500 | $158,300 |
| 2021 | $4,020 | $286,100 | $138,800 | $147,300 |
| 2020 | $3,959 | $264,300 | $121,000 | $143,300 |
| 2019 | $3,768 | $245,000 | $115,300 | $129,700 |
| 2018 | $3,651 | $223,700 | $107,400 | $116,300 |
| 2017 | $3,583 | $214,400 | $103,300 | $111,100 |
| 2016 | $3,386 | $194,800 | $97,700 | $97,100 |
| 2015 | $3,325 | $186,600 | $97,200 | $89,400 |
Source: Public Records
Map
Nearby Homes
- 131 Mellen St Unit 3B
- 302 Hollis St Unit R
- 292 Hollis St
- 15 Bates Rd
- 25 Eames St
- 84 Bethany Rd
- 77 Arlington St
- 13 Washington Ave
- 29 Gordon St Unit 107
- 16 Alexander St
- 45 Daytona Ave
- 818 Waverly St
- 17 Taylor St
- 72 Pond St
- 18 Beaver Ct
- 120 Franklin St
- 8 Bellmore Rd
- 15 Bellmore Rd
- 33 Clinton St
- 7 Weld St Unit 50