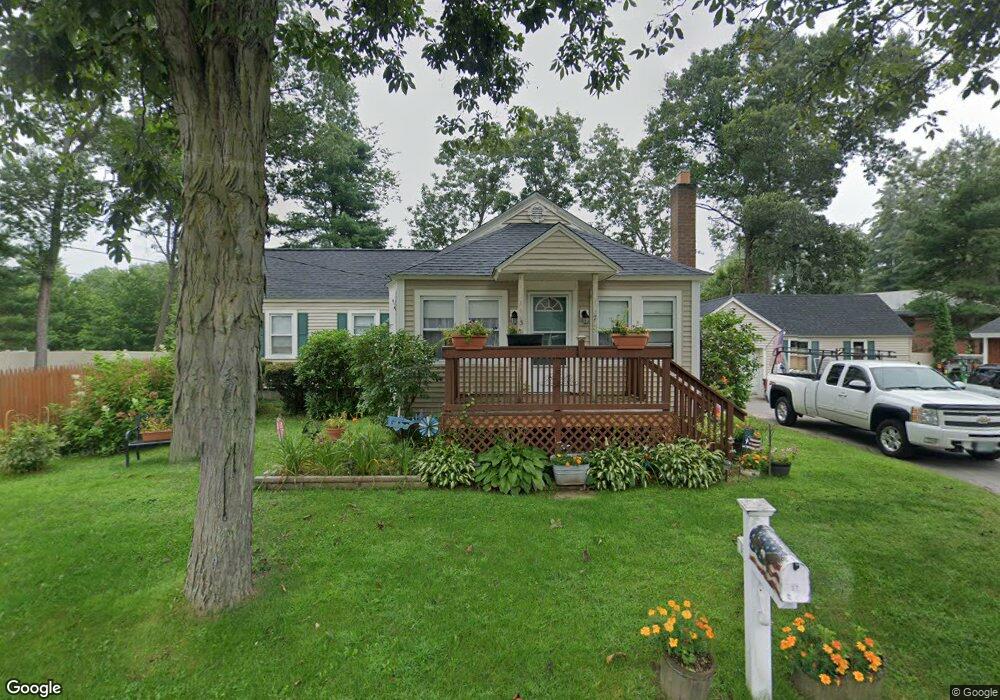
37 Nivelle St Concord, NH 03301
South End NeighborhoodEstimated Value: $412,460 - $469,000
2
Beds
1
Bath
1,234
Sq Ft
$357/Sq Ft
Est. Value
About This Home
This home is located at 37 Nivelle St, Concord, NH 03301 and is currently estimated at $440,865, approximately $357 per square foot. 37 Nivelle St is a home located in Merrimack County with nearby schools including Abbot-Downing School, Rundlett Middle School, and Concord High School.
Ownership History
Date
Name
Owned For
Owner Type
Purchase Details
Closed on
Dec 1, 2022
Sold by
Patten Robert A
Bought by
Robert A Patten Ft
Current Estimated Value
Purchase Details
Closed on
Jul 1, 2005
Sold by
Auger Holly
Bought by
Patten Robert A and Patten Jeanette P
Home Financials for this Owner
Home Financials are based on the most recent Mortgage that was taken out on this home.
Original Mortgage
$220,000
Interest Rate
5.73%
Mortgage Type
Purchase Money Mortgage
Create a Home Valuation Report for This Property
The Home Valuation Report is an in-depth analysis detailing your home's value as well as a comparison with similar homes in the area
Home Values in the Area
Average Home Value in this Area
Purchase History
| Date | Buyer | Sale Price | Title Company |
|---|---|---|---|
| Robert A Patten Ft | -- | None Available | |
| Patten Robert A | $220,000 | -- | |
| Patten Robert A | $220,000 | -- |
Source: Public Records
Mortgage History
| Date | Status | Borrower | Loan Amount |
|---|---|---|---|
| Previous Owner | Patten Robert A | $220,000 |
Source: Public Records
Tax History Compared to Growth
Tax History
| Year | Tax Paid | Tax Assessment Tax Assessment Total Assessment is a certain percentage of the fair market value that is determined by local assessors to be the total taxable value of land and additions on the property. | Land | Improvement |
|---|---|---|---|---|
| 2024 | $6,651 | $240,200 | $104,400 | $135,800 |
| 2023 | $6,452 | $240,200 | $104,400 | $135,800 |
| 2022 | $6,219 | $240,200 | $104,400 | $135,800 |
| 2021 | $6,034 | $240,200 | $104,400 | $135,800 |
| 2020 | $5,719 | $213,700 | $87,300 | $126,400 |
| 2019 | $5,439 | $195,800 | $85,900 | $109,900 |
| 2018 | $5,031 | $183,800 | $82,500 | $101,300 |
| 2017 | $4,984 | $176,500 | $81,000 | $95,500 |
| 2016 | $4,526 | $169,000 | $81,000 | $88,000 |
| 2015 | $4,306 | $155,300 | $73,600 | $81,700 |
| 2014 | $4,014 | $155,300 | $73,600 | $81,700 |
| 2013 | -- | $152,300 | $73,600 | $78,700 |
| 2012 | -- | $151,300 | $73,600 | $77,700 |
Source: Public Records
Map
Nearby Homes