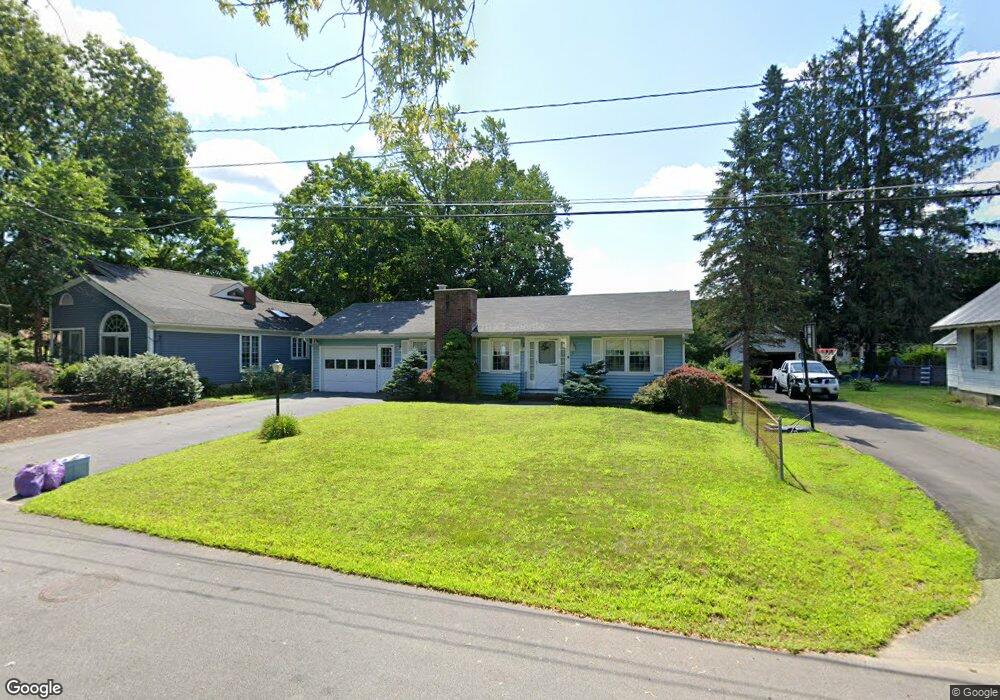
37 Noyes St Concord, NH 03301
South End NeighborhoodEstimated Value: $406,699 - $471,000
2
Beds
1
Bath
975
Sq Ft
$440/Sq Ft
Est. Value
About This Home
This home is located at 37 Noyes St, Concord, NH 03301 and is currently estimated at $428,925, approximately $439 per square foot. 37 Noyes St is a home located in Merrimack County with nearby schools including Abbot-Downing School, Rundlett Middle School, and Concord High School.
Ownership History
Date
Name
Owned For
Owner Type
Purchase Details
Closed on
Feb 12, 2020
Sold by
Bargiel Albert M
Bought by
Albert M Bargiel T M and Albert Bargiel
Current Estimated Value
Purchase Details
Closed on
Sep 9, 2003
Sold by
Morgan Patricia M
Bought by
Bargiel Sharon E and Bargiel Albert M
Home Financials for this Owner
Home Financials are based on the most recent Mortgage that was taken out on this home.
Original Mortgage
$110,900
Interest Rate
6.02%
Mortgage Type
Purchase Money Mortgage
Create a Home Valuation Report for This Property
The Home Valuation Report is an in-depth analysis detailing your home's value as well as a comparison with similar homes in the area
Home Values in the Area
Average Home Value in this Area
Purchase History
| Date | Buyer | Sale Price | Title Company |
|---|---|---|---|
| Albert M Bargiel T M | -- | None Available | |
| Bargiel Sharon E | $200,900 | -- |
Source: Public Records
Mortgage History
| Date | Status | Borrower | Loan Amount |
|---|---|---|---|
| Previous Owner | Bargiel Sharon E | $110,900 |
Source: Public Records
Tax History Compared to Growth
Tax History
| Year | Tax Paid | Tax Assessment Tax Assessment Total Assessment is a certain percentage of the fair market value that is determined by local assessors to be the total taxable value of land and additions on the property. | Land | Improvement |
|---|---|---|---|---|
| 2024 | $7,438 | $268,600 | $108,800 | $159,800 |
| 2023 | $7,215 | $268,600 | $108,800 | $159,800 |
| 2022 | $6,954 | $268,600 | $108,800 | $159,800 |
| 2021 | $6,750 | $268,700 | $108,900 | $159,800 |
| 2020 | $6,401 | $239,200 | $87,000 | $152,200 |
| 2019 | $6,064 | $218,300 | $85,200 | $133,100 |
| 2018 | $5,852 | $207,600 | $85,200 | $122,400 |
| 2017 | $5,637 | $199,600 | $85,200 | $114,400 |
| 2016 | $5,321 | $192,300 | $83,600 | $108,700 |
| 2015 | $5,055 | $180,000 | $87,200 | $92,800 |
| 2014 | $4,826 | $180,000 | $87,200 | $92,800 |
| 2013 | -- | $177,600 | $87,200 | $90,400 |
| 2012 | -- | $171,600 | $87,200 | $84,400 |
Source: Public Records
Map
Nearby Homes
- 122 South St
- 12 Avon St
- 0 South St Unit 4969509
- 22 Wilson Ave
- 15 Wilson Ave
- 0 Spruce St Unit 88
- 33 Spruce St
- 47 South St
- 24 Badger St
- 105 S Main St
- 14 Downing St
- 75 S State St
- 14-16 Perley St
- 10 Perley St
- 2 Kensington Rd
- 25 Fayette St
- 1 Kensington Rd
- 87 S Main St Unit 2
- 376 S Main St
- 54 Pleasant St Unit 8