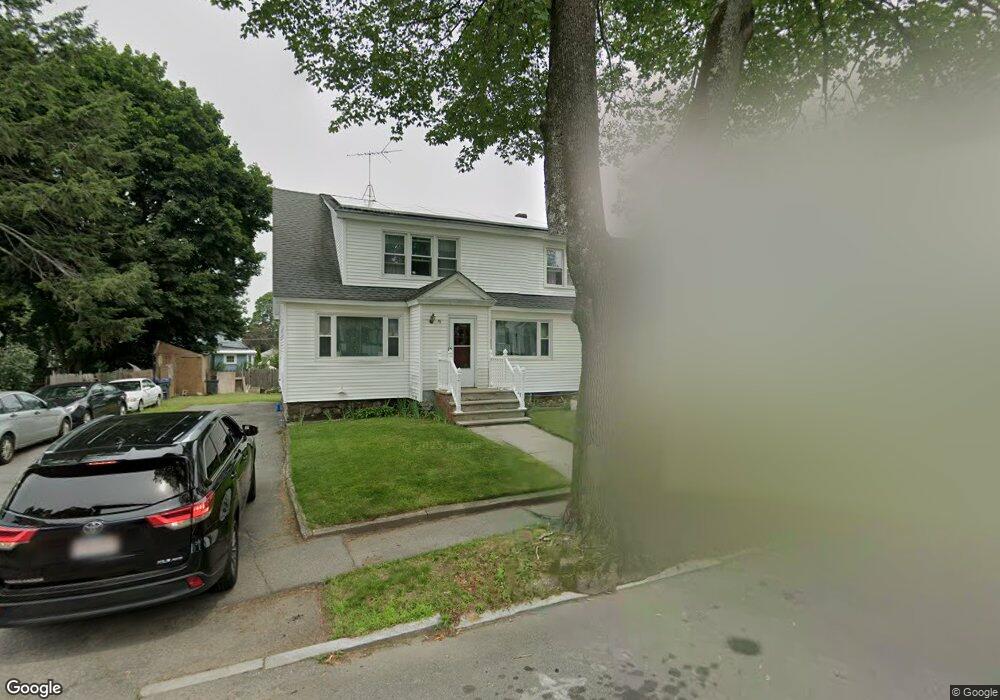
37 Olive St Methuen, MA 01844
The East End NeighborhoodEstimated Value: $764,000 - $905,000
4
Beds
3
Baths
4,240
Sq Ft
$196/Sq Ft
Est. Value
About This Home
This home is located at 37 Olive St, Methuen, MA 01844 and is currently estimated at $830,892, approximately $195 per square foot. 37 Olive St is a home located in Essex County with nearby schools including Timony Grammar School, Methuen High School, and Community Day Charter Public School - Gateway.
Ownership History
Date
Name
Owned For
Owner Type
Purchase Details
Closed on
Jun 28, 2002
Sold by
Romeo Samuel and Romeo Agnes
Bought by
Achuo Henry Mua and Kaniaru Veronica W
Current Estimated Value
Home Financials for this Owner
Home Financials are based on the most recent Mortgage that was taken out on this home.
Original Mortgage
$284,453
Interest Rate
6.92%
Mortgage Type
Purchase Money Mortgage
Create a Home Valuation Report for This Property
The Home Valuation Report is an in-depth analysis detailing your home's value as well as a comparison with similar homes in the area
Home Values in the Area
Average Home Value in this Area
Purchase History
| Date | Buyer | Sale Price | Title Company |
|---|---|---|---|
| Achuo Henry Mua | $300,000 | -- | |
| Achuo Henry Mua | $300,000 | -- |
Source: Public Records
Mortgage History
| Date | Status | Borrower | Loan Amount |
|---|---|---|---|
| Open | Achuo Henry Mua | $193,000 | |
| Closed | Achuo Henry Mua | $284,453 |
Source: Public Records
Tax History
| Year | Tax Paid | Tax Assessment Tax Assessment Total Assessment is a certain percentage of the fair market value that is determined by local assessors to be the total taxable value of land and additions on the property. | Land | Improvement |
|---|---|---|---|---|
| 2025 | $8,447 | $798,400 | $207,200 | $591,200 |
| 2024 | $7,689 | $708,000 | $189,000 | $519,000 |
| 2023 | $7,158 | $611,800 | $168,000 | $443,800 |
| 2022 | $6,451 | $494,300 | $133,000 | $361,300 |
| 2021 | $6,156 | $466,700 | $126,000 | $340,700 |
| 2020 | $5,719 | $425,500 | $126,000 | $299,500 |
| 2019 | $5,792 | $408,200 | $119,000 | $289,200 |
| 2018 | $5,229 | $366,400 | $112,000 | $254,400 |
| 2017 | $5,081 | $346,800 | $112,000 | $234,800 |
| 2016 | $4,670 | $315,300 | $98,000 | $217,300 |
| 2015 | $4,444 | $304,400 | $98,000 | $206,400 |
Source: Public Records
Map
Nearby Homes
- 24 Court St
- 15 Swan Ave
- 160 1/2 East St
- 24 Boylston St
- 63 Lippold St
- 35 Swan Ave
- 6 Longwood Dr
- 5 Weisner Pkwy
- 37 Albion St
- 2 Oak Knoll Rd
- 169 Berkeley St
- 106 Leroy Ave
- 68 Ashford St
- 144 Ferry St
- 21 Oak St Unit A
- 14 Buttonwood Dr
- 129-131 Lexington St
- 3 Thissell St
- 270 E Haverhill St Unit 12
- 192 Union St